> ## Documentation Index
> Fetch the complete documentation index at: https://docs.retellai.com/llms.txt
> Use this file to discover all available pages before exploring further.
# View QA Results
> Read your Retell AI QA results: review aggregate metrics, drill into individual calls, inspect transcripts with QA diagnostics, and filter by error type.
## Overview
The QA Results dashboard provides comprehensive insights into your call quality through two main views: **Call QA Overview** for high-level trends and metrics, and **Detailed Calls** for individual call analysis. You can drill down into specific calls to review detailed QA diagnostics, errors, and transcripts.
## Accessing QA Results
After creating a QA cohort and running analysis, navigate to your cohort to view the results. The dashboard displays:
* **Summary metrics** across all analyzed calls
* **Trend charts** showing performance over time
* **Individual call records** with detailed evaluation scores
* **Call-level QA sheets** with transcript analysis and error details
## Call QA Overview Tab
The **Call QA Overview** tab provides a high-level view of your cohort's performance with interactive charts and summary metrics.
### Summary Metrics
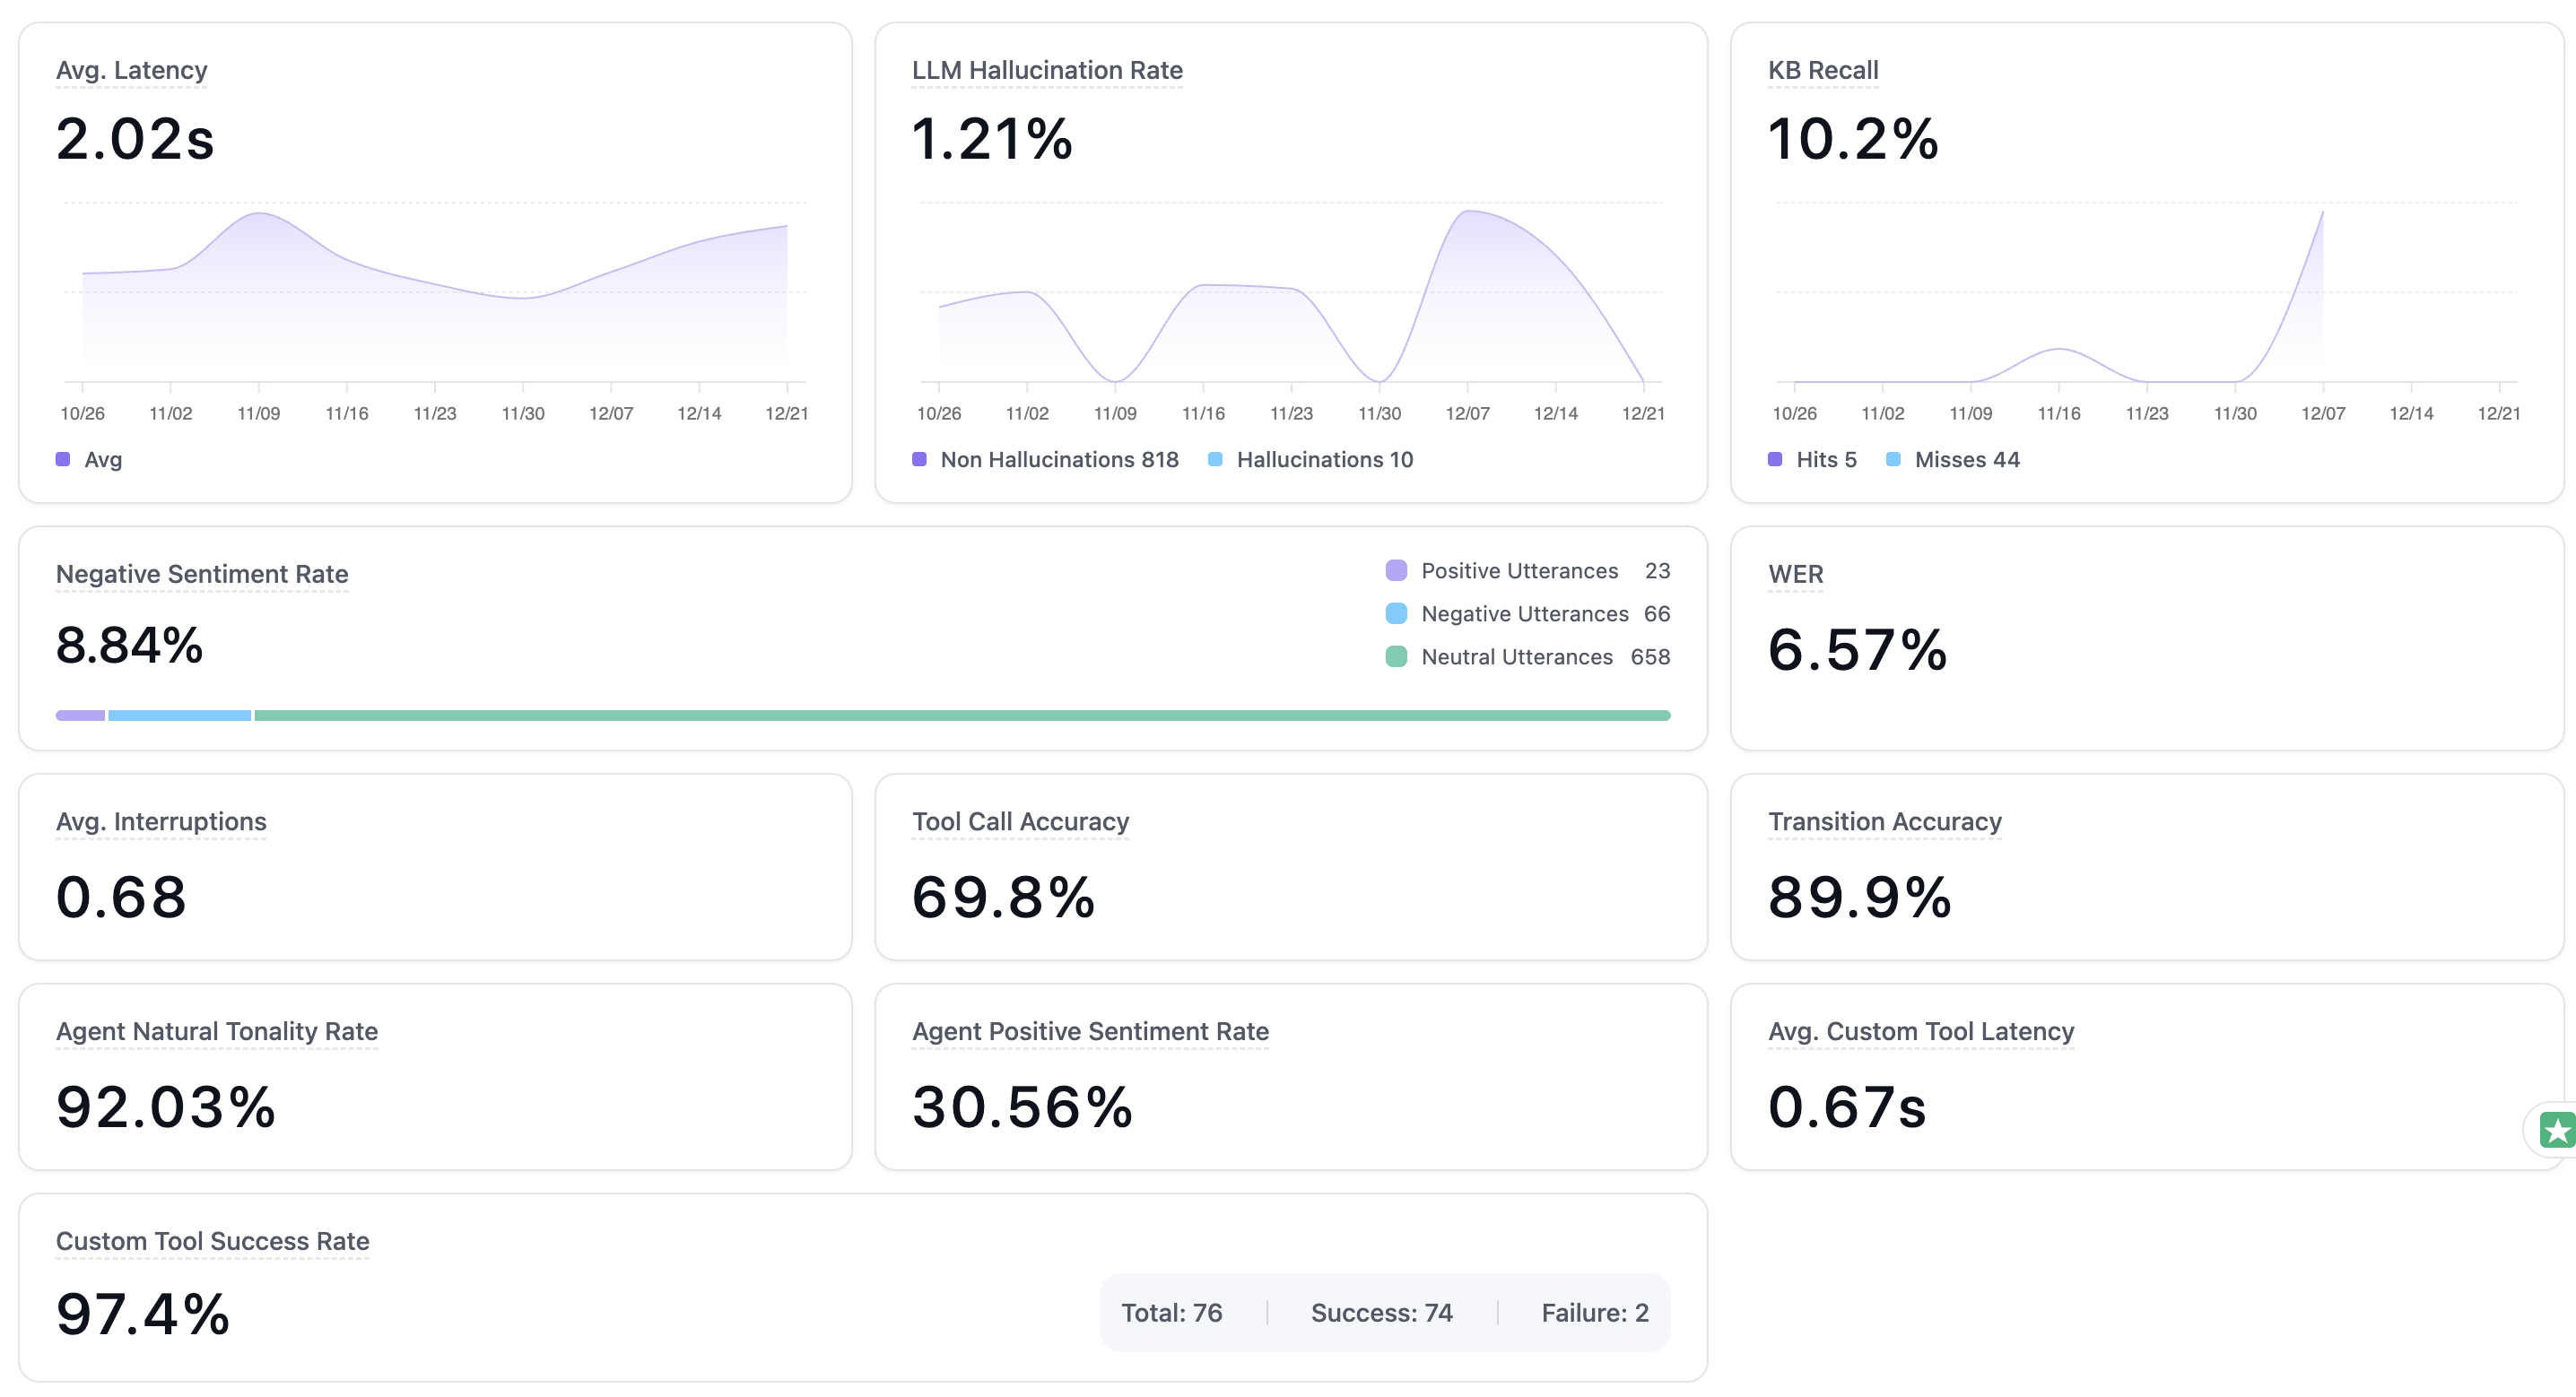
The top section displays key performance indicators (KPIs) in a grid layout:
* **Calls Analyzed**: Total number of calls analyzed in the cohort
* **Average Score**: Overall quality score based on your resolution criteria
* **Call Resolution Rate**: Percentage of calls successfully resolved
* **Transfer Success Rate**: Percentage of calls that were successfully transferred to another agent or system
* **Transfer Wait Time**: Average time users wait before a transfer is completed
* **Average Latency**: Mean response time across all calls
* **LLM Hallucination Rate**: Percentage of calls with AI-generated inaccuracies
* **KB (Knowledge Base) Recall**: Knowledge base retrieval effectiveness
* **Negative Sentiment Rate**: Percentage of interactions with negative sentiment
* **WER (Word Error Rate)**: Transcription accuracy
* **Avg. Overlapping Speech**: Average number of overlapping speech instances per call
* **Tool Call Accuracy**: Rate of correct tool/function invocations
* **Transition Accuracy**: Accuracy of conversation flow transitions
* **Agent Natural Tonality Rate**: Percentage of natural-sounding agent speech
* **Agent Positive Sentiment Rate**: Percentage of agent responses with positive sentiment
* **Avg Custom Tool Latency**: Average time taken for custom tools to execute and return results
* **Custom Tool Success Rate**: Percentage of custom tool calls that completed successfully
 ### Top Questions from Users
The dashboard includes a table showing the most frequently asked questions by users, along with resolution rates:
### Top Questions from Users
The dashboard includes a table showing the most frequently asked questions by users, along with resolution rates:
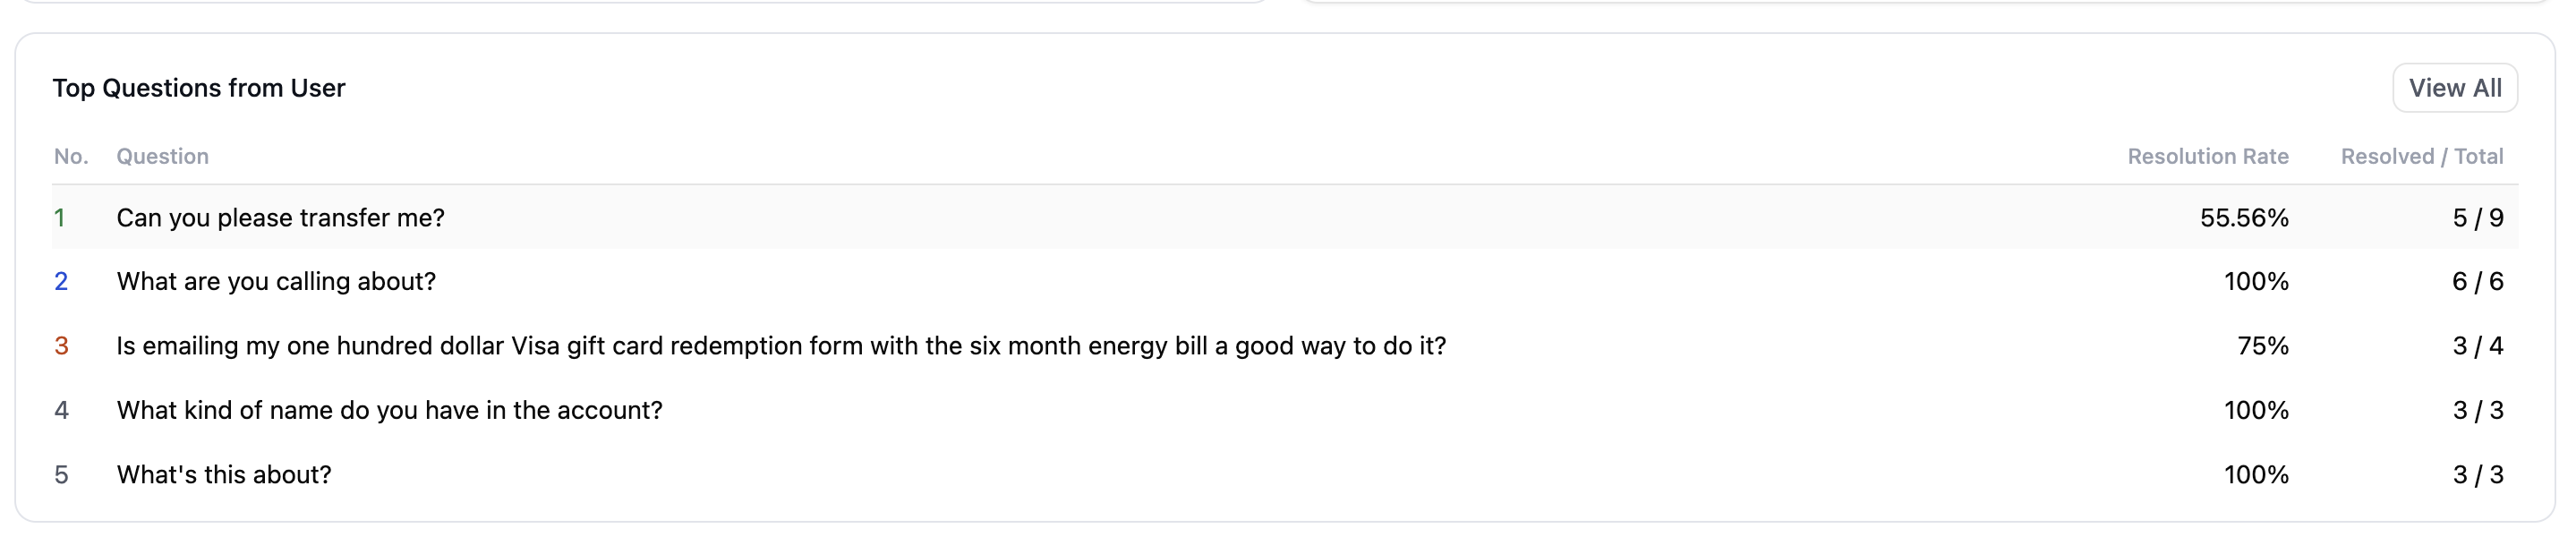 AI QA intelligently groups similar questions to provide a consolidated view.
For example, the questions “What are your office hours?” and “What time do you open?” are grouped together.
## Detailed Calls Tab
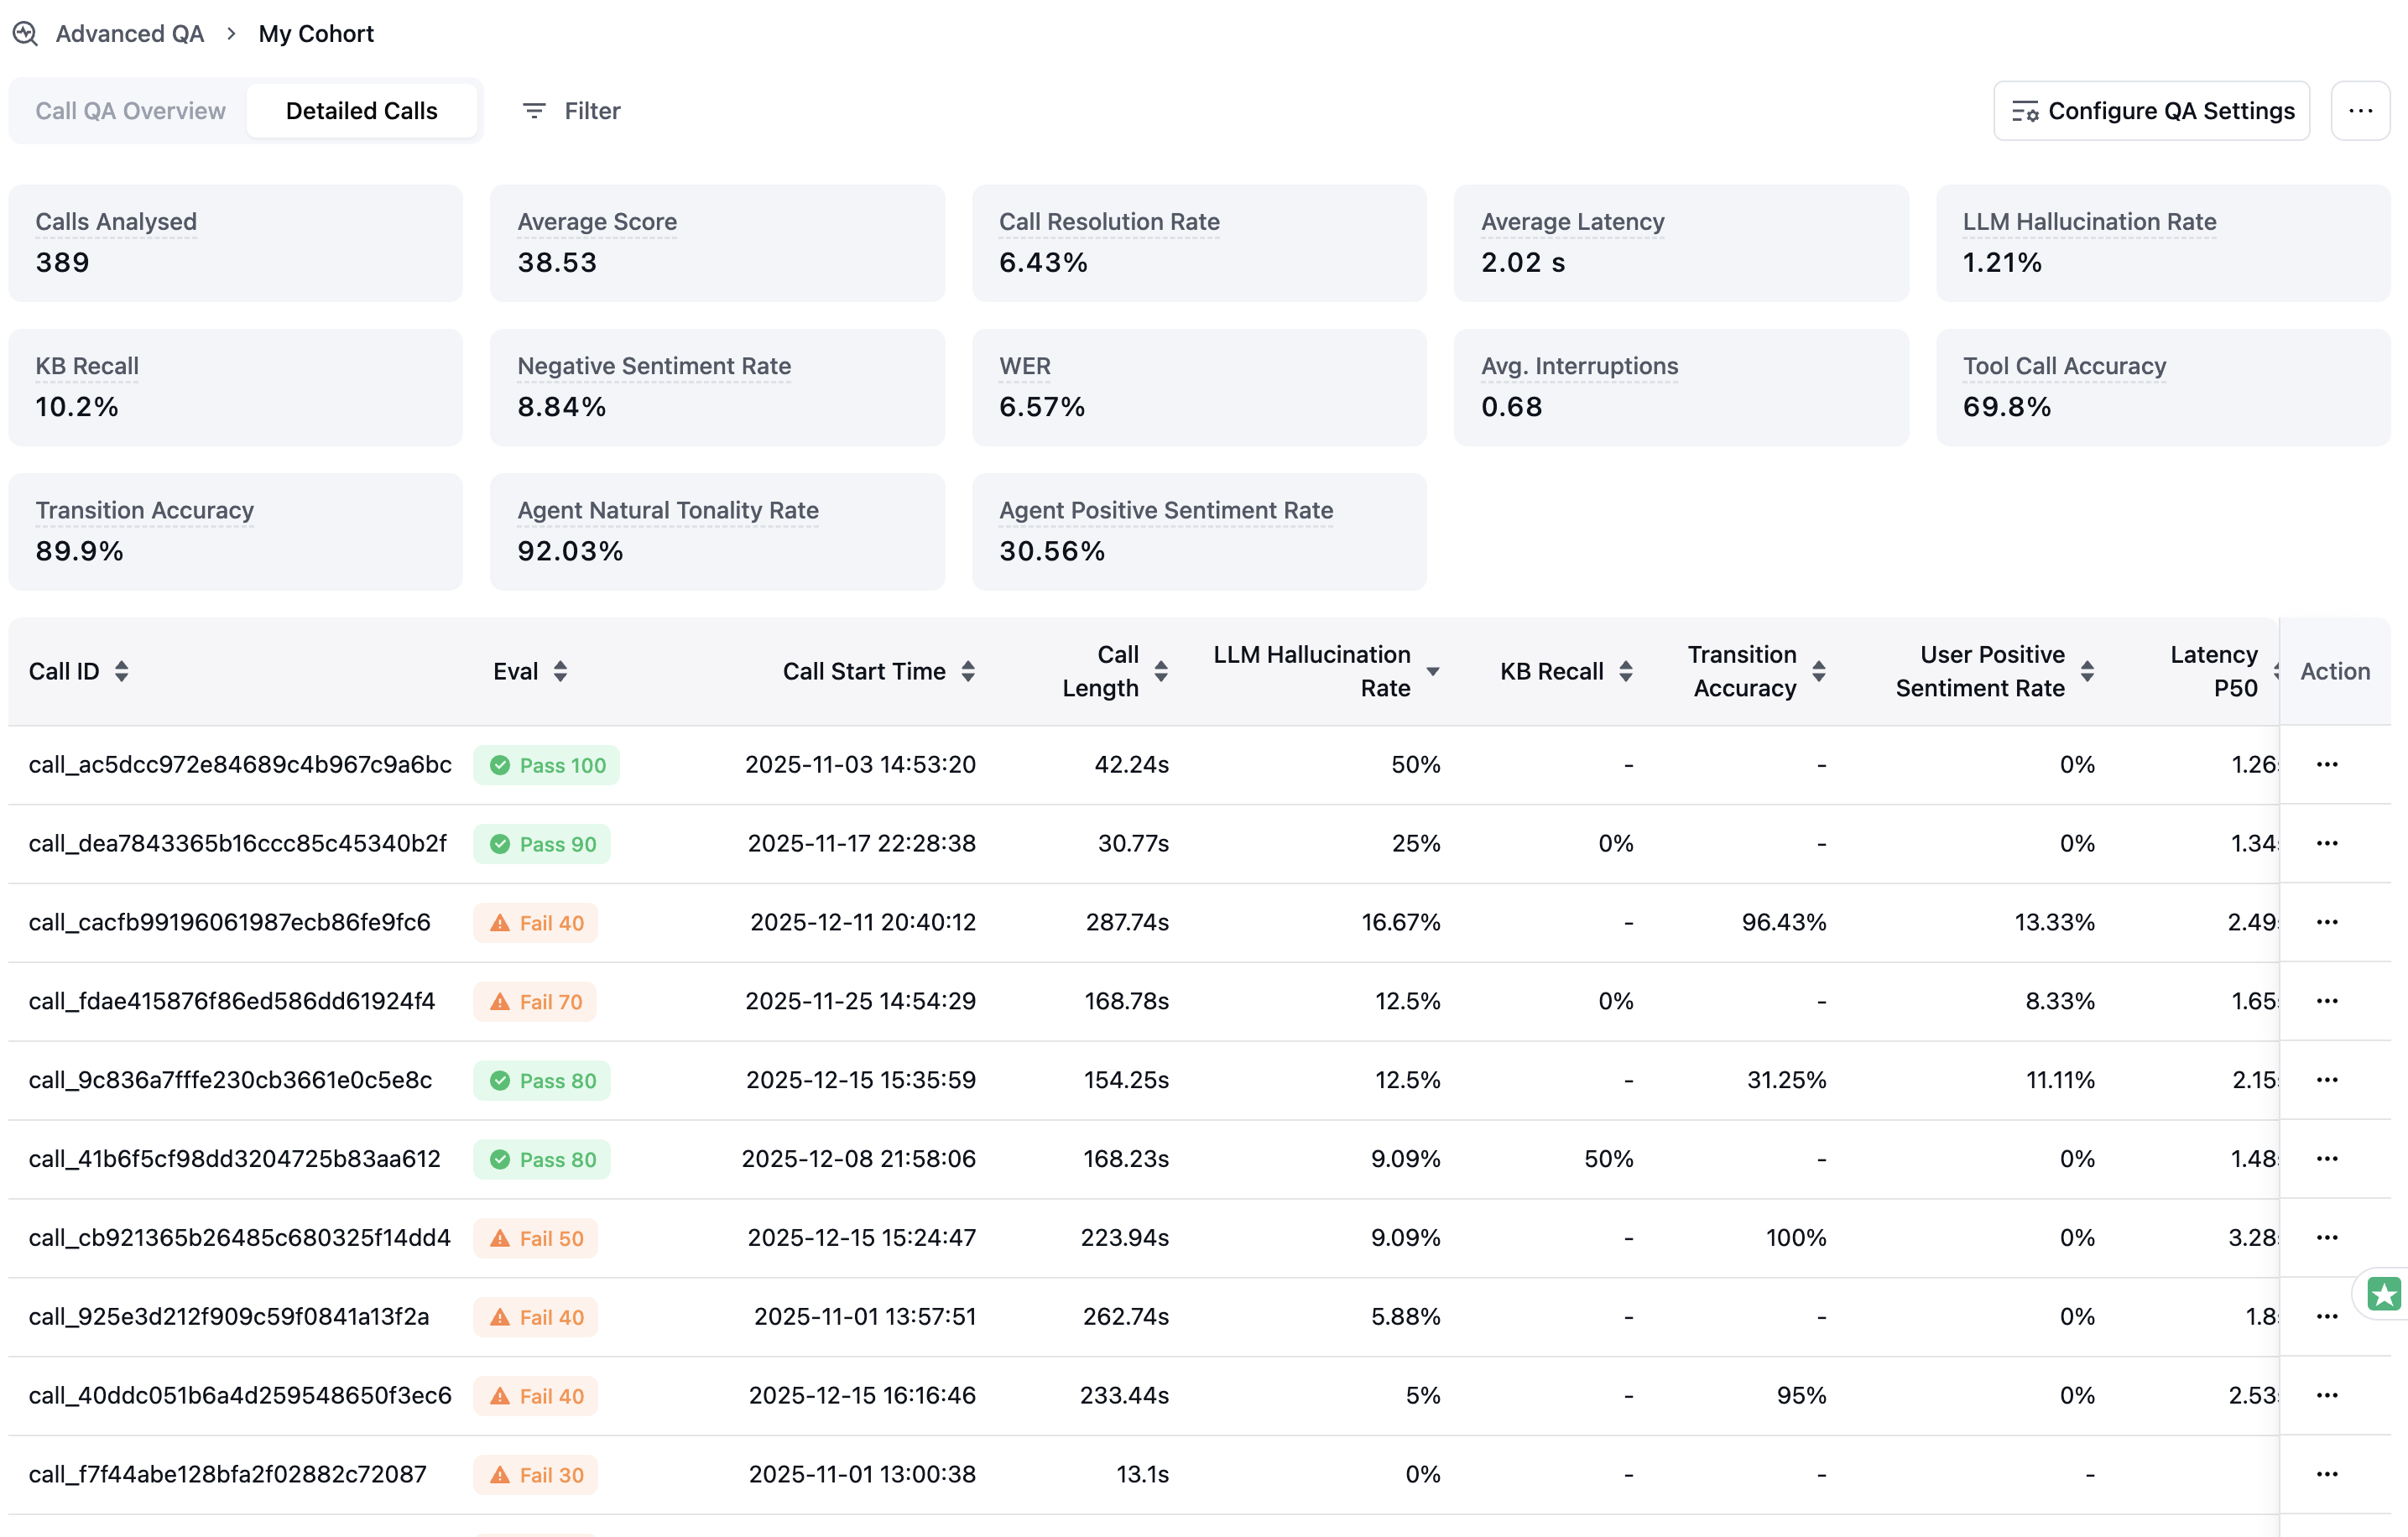
The **Detailed Calls** tab provides a comprehensive table of all analyzed calls with sortable columns and detailed metrics for each call.
AI QA intelligently groups similar questions to provide a consolidated view.
For example, the questions “What are your office hours?” and “What time do you open?” are grouped together.
## Detailed Calls Tab
The **Detailed Calls** tab provides a comprehensive table of all analyzed calls with sortable columns and detailed metrics for each call.
 ### Calls Table
The table displays the following information for each call:
* Call ID
* Eval
* Call Start Time
* Call Length
* LLM Hallucination Rate
* KB Recall
* Transition Accuracy
* User Positive Sentiment Rate
* Latency P50
* Overlapping Speech Count
* WER
* Tool Call Accuracy
* Natural Tonality Rate
### Sorting and Filtering
* **Sort columns**: Click any column header to sort by that metric
* **Filter calls**: Use the Filter button to apply date ranges, score thresholds, etc.
Use the ellipsis menu (⋯) in the Action column to:
* Rerun QA for a call
* Delete a call from QA
## Call-Level QA Sheet
Clicking on any row in the Detailed Calls table opens a **Call QA Sheet** that provides comprehensive diagnostics for that specific call.
### QA Result Overview
The QA sheet displays:
* **Overall Score**: Pass/Fail status with numerical score
* **Passed Metrics**: Metrics that met the defined thresholds (shown with green checkmarks)
* **Failed Metrics**: Metrics that didn't meet thresholds (shown with orange warning triangles)
### Calls Table
The table displays the following information for each call:
* Call ID
* Eval
* Call Start Time
* Call Length
* LLM Hallucination Rate
* KB Recall
* Transition Accuracy
* User Positive Sentiment Rate
* Latency P50
* Overlapping Speech Count
* WER
* Tool Call Accuracy
* Natural Tonality Rate
### Sorting and Filtering
* **Sort columns**: Click any column header to sort by that metric
* **Filter calls**: Use the Filter button to apply date ranges, score thresholds, etc.
Use the ellipsis menu (⋯) in the Action column to:
* Rerun QA for a call
* Delete a call from QA
## Call-Level QA Sheet
Clicking on any row in the Detailed Calls table opens a **Call QA Sheet** that provides comprehensive diagnostics for that specific call.
### QA Result Overview
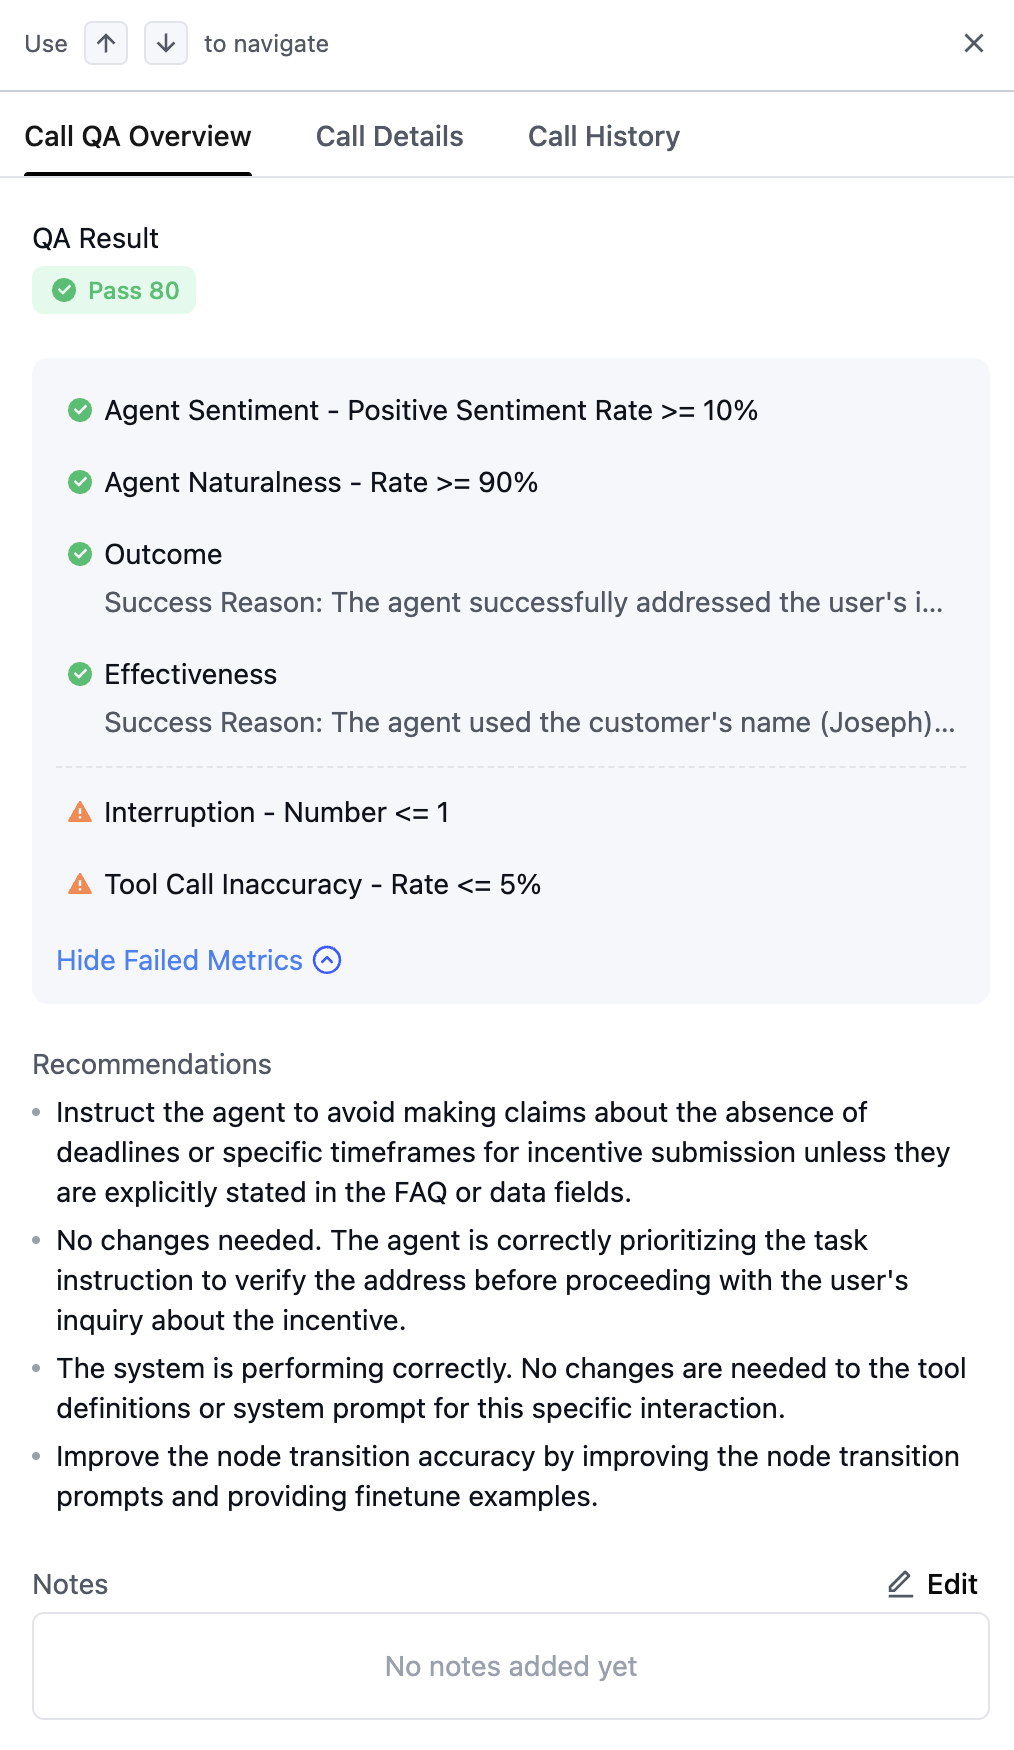
The QA sheet displays:
* **Overall Score**: Pass/Fail status with numerical score
* **Passed Metrics**: Metrics that met the defined thresholds (shown with green checkmarks)
* **Failed Metrics**: Metrics that didn't meet thresholds (shown with orange warning triangles)
 ### Calibrate Call QA
You can calibrate individual call QA results by manually adjusting metric evaluations:
* **Mark passed metrics as failed**: Override automatic evaluation if a metric should have failed
* **Mark failed metrics as passed**: Override automatic evaluation if a metric should have passed
You can also add custom notes to any call QA.
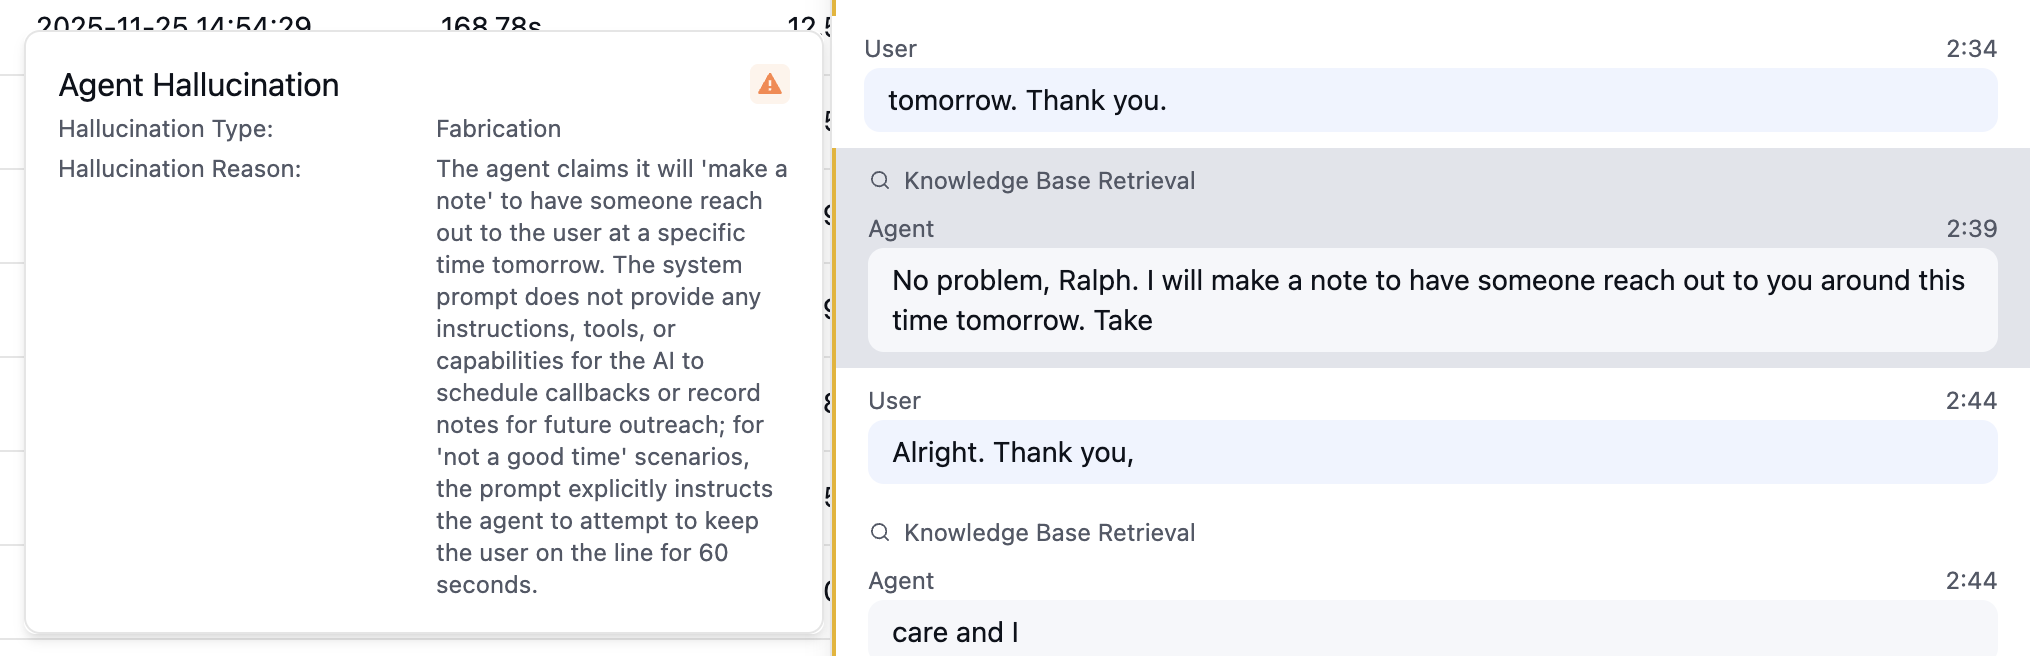
### Transcript and Errors
The QA sheet provides access to:
* **Full call transcript**: Complete conversation between user and agent
* **Transcript errors**: Specific transcription mistakes with corrections
* **Error highlights**: Visual indicators showing where errors occurred
### Calibrate Call QA
You can calibrate individual call QA results by manually adjusting metric evaluations:
* **Mark passed metrics as failed**: Override automatic evaluation if a metric should have failed
* **Mark failed metrics as passed**: Override automatic evaluation if a metric should have passed
You can also add custom notes to any call QA.
### Transcript and Errors
The QA sheet provides access to:
* **Full call transcript**: Complete conversation between user and agent
* **Transcript errors**: Specific transcription mistakes with corrections
* **Error highlights**: Visual indicators showing where errors occurred
 Low scores or high failure rates may indicate systemic issues with your agent configuration, prompts, or knowledge base. Review multiple failed calls to identify patterns before making changes.