> ## Documentation Index
> Fetch the complete documentation index at: https://docs.retellai.com/llms.txt
> Use this file to discover all available pages before exploring further.
# Build analytics dashboards
> Build analytics dashboards with Retell AI Conductor. Describe the metrics you need, attach charts for context, and review proposed changes before applying them.
Ask Conductor to build an analytics dashboard or improve one you already use. Describe what you want to measure, then review its proposed changes before applying them.
## When to use it
Use Conductor when you know the question you want a dashboard to answer and need help choosing or configuring charts. You can also ask it to explain an existing chart or suggest improvements to a dashboard.
For example, an appointment-booking team could ask: "Help me build a call dashboard showing call volume, success rate, and average duration by week. Break it down by agent."
## Not sure where to start?
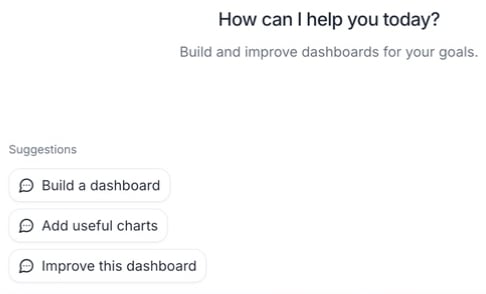
Open a new Conductor conversation on **Analytics** and choose a starter suggestion. It fills the message box so you can edit it before sending:
* **Build a dashboard** — describe what you want to measure and why.
* **Add useful charts** — choose charts that support your dashboard’s goals.
* **Improve this dashboard** — review the current dashboard and suggest improvements.
 ## Build or improve a dashboard
Go to **Analytics**, select the dashboard you want to work on, and open **Conductor**.
Ask for a new dashboard, a dashboard name change, or charts to add, update, or remove. Include whether you want call or chat data, the metrics, the time range, and any filters or breakdowns.
For example: "Add a chart showing unsuccessful calls over the last four weeks, broken down by disconnection reason."
Review the proposed dashboard and chart changes. Accept the changes you want, reject the others, then submit your review in Conductor.
## Build or improve a dashboard
Go to **Analytics**, select the dashboard you want to work on, and open **Conductor**.
Ask for a new dashboard, a dashboard name change, or charts to add, update, or remove. Include whether you want call or chat data, the metrics, the time range, and any filters or breakdowns.
For example: "Add a chart showing unsuccessful calls over the last four weeks, broken down by disconnection reason."
Review the proposed dashboard and chart changes. Accept the changes you want, reject the others, then submit your review in Conductor.
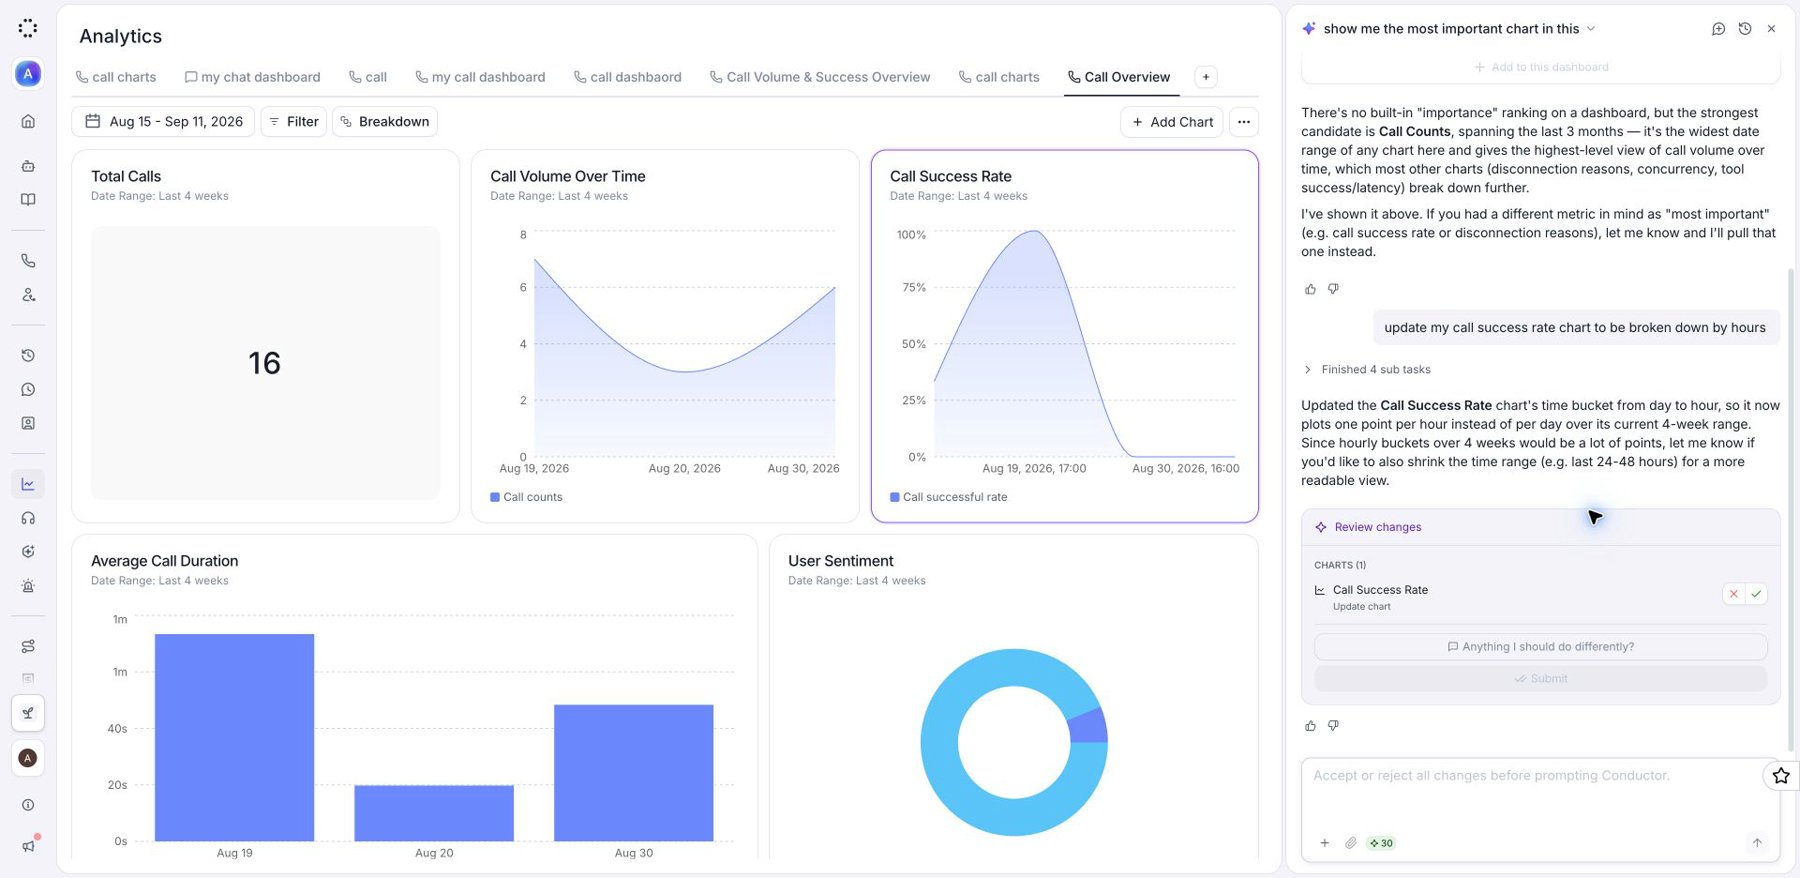
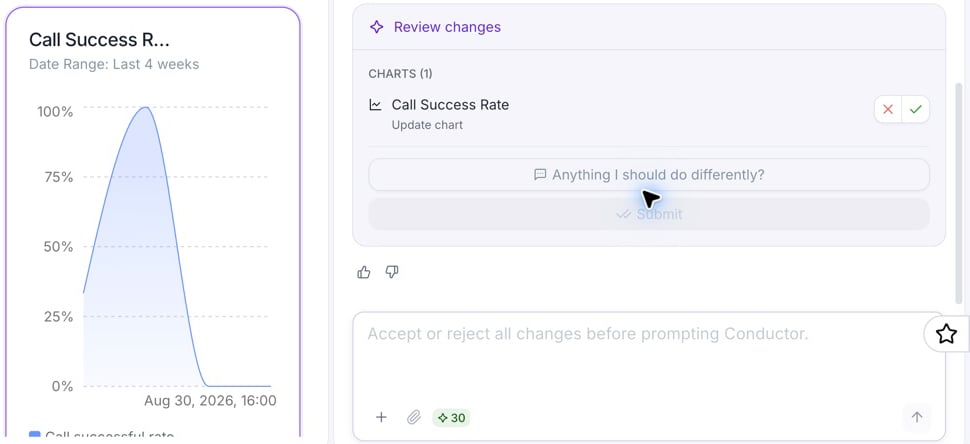 Click a proposed change to find the affected chart or setting. Where available, use **View original** and **View proposed** to compare versions. Use **Undo** to change a decision before submitting.
If the proposal belongs to another dashboard, click **Open this dashboard** to review it there. Finish the pending review before manually editing charts or dashboard settings.
See [Analytics dashboard](/features/analytics-dashboard) for available metrics, chart types, filters, and breakdowns.
## Change global filters and breakdowns
Ask Conductor to change **global filters and breakdowns** when you want the change to apply across the dashboard. Global filters limit which calls or chats appear in every chart; global breakdowns group the results across charts, such as by agent or agent version.
For example:
* "Filter this entire dashboard to inbound calls."
* "Break down every chart on this dashboard by agent."
* "Remove the global agent breakdown from this dashboard."
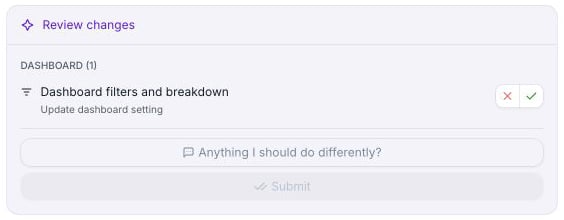
Conductor includes these changes in its dashboard proposal. Review the proposed **Filter** and **Breakdown** settings in the dashboard header, accept or reject them, then submit your review.
Click a proposed change to find the affected chart or setting. Where available, use **View original** and **View proposed** to compare versions. Use **Undo** to change a decision before submitting.
If the proposal belongs to another dashboard, click **Open this dashboard** to review it there. Finish the pending review before manually editing charts or dashboard settings.
See [Analytics dashboard](/features/analytics-dashboard) for available metrics, chart types, filters, and breakdowns.
## Change global filters and breakdowns
Ask Conductor to change **global filters and breakdowns** when you want the change to apply across the dashboard. Global filters limit which calls or chats appear in every chart; global breakdowns group the results across charts, such as by agent or agent version.
For example:
* "Filter this entire dashboard to inbound calls."
* "Break down every chart on this dashboard by agent."
* "Remove the global agent breakdown from this dashboard."
Conductor includes these changes in its dashboard proposal. Review the proposed **Filter** and **Breakdown** settings in the dashboard header, accept or reject them, then submit your review.

 If you only want to change one chart, name or attach that chart and say so. Chart-level filters are combined with the global filters, so both restrictions apply. See [Filters and breakdowns](/features/analytics-dashboard#filters-and-breakdowns) for the available fields.
Conductor can also return a [navigation link](/conductor/overview#open-pages-from-conductor-replies) to an analytics dashboard with filters and breakdowns included. Click **View** to open that selection and keep the conversation alongside it.
## Give Conductor chart context
With Conductor open on **Analytics**, click a chart to attach it as context, then ask your question. For example: "Explain what this chart measures and suggest a breakdown to help compare agents."
You can also use **Add context** (+): choose **Charts** for charts on the current dashboard, or **Analytics** to attach a dashboard. To attach several items, use **Multi-select**, select them, and click **Save**. Check the context chips before sending your message.
See [Give Conductor context](/conductor/overview#give-conductor-context) for other resources you can attach.
## View charts in chat
Conductor can show a chart directly in its reply so you can inspect the result without first adding it to a dashboard. Ask for a metric and time range, such as "Show call counts over the last three months."
The chart shows a snapshot of the results returned with that reply, rather than refreshing as dashboard data changes. You can keep discussing it in chat or save it to a dashboard.
If you only want to change one chart, name or attach that chart and say so. Chart-level filters are combined with the global filters, so both restrictions apply. See [Filters and breakdowns](/features/analytics-dashboard#filters-and-breakdowns) for the available fields.
Conductor can also return a [navigation link](/conductor/overview#open-pages-from-conductor-replies) to an analytics dashboard with filters and breakdowns included. Click **View** to open that selection and keep the conversation alongside it.
## Give Conductor chart context
With Conductor open on **Analytics**, click a chart to attach it as context, then ask your question. For example: "Explain what this chart measures and suggest a breakdown to help compare agents."
You can also use **Add context** (+): choose **Charts** for charts on the current dashboard, or **Analytics** to attach a dashboard. To attach several items, use **Multi-select**, select them, and click **Save**. Check the context chips before sending your message.
See [Give Conductor context](/conductor/overview#give-conductor-context) for other resources you can attach.
## View charts in chat
Conductor can show a chart directly in its reply so you can inspect the result without first adding it to a dashboard. Ask for a metric and time range, such as "Show call counts over the last three months."
The chart shows a snapshot of the results returned with that reply, rather than refreshing as dashboard data changes. You can keep discussing it in chat or save it to a dashboard.
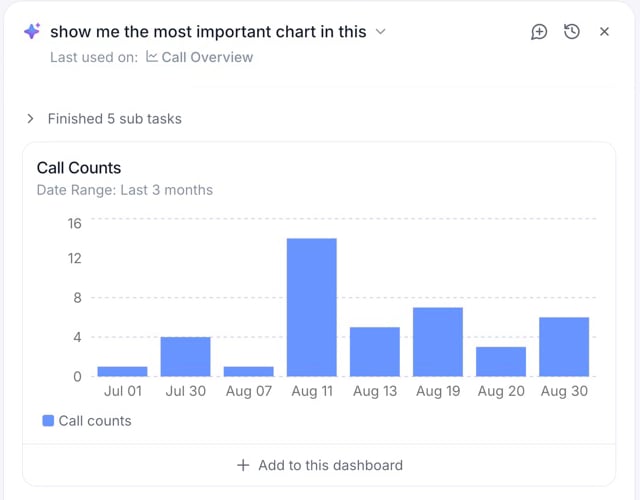 When Conductor returns a chart in its reply, click **Add to this dashboard** to save it to the dashboard currently open in Analytics. From another page, click **Use in Analytics** first.
The chart and dashboard must use the same data source: call charts belong on call dashboards, and chat charts on chat dashboards. Adding a chart requires analytics edit access. Finish any pending Conductor review before adding it.
When Conductor returns a chart in its reply, click **Add to this dashboard** to save it to the dashboard currently open in Analytics. From another page, click **Use in Analytics** first.
The chart and dashboard must use the same data source: call charts belong on call dashboards, and chat charts on chat dashboards. Adding a chart requires analytics edit access. Finish any pending Conductor review before adding it.