> ## Documentation Index
> Fetch the complete documentation index at: https://docs.retellai.com/llms.txt
> Use this file to discover all available pages before exploring further.
# Alerting
> Set up Retell alerts to monitor voice AI operations — get email or webhook notifications when call volume, failures, or latency cross your thresholds.
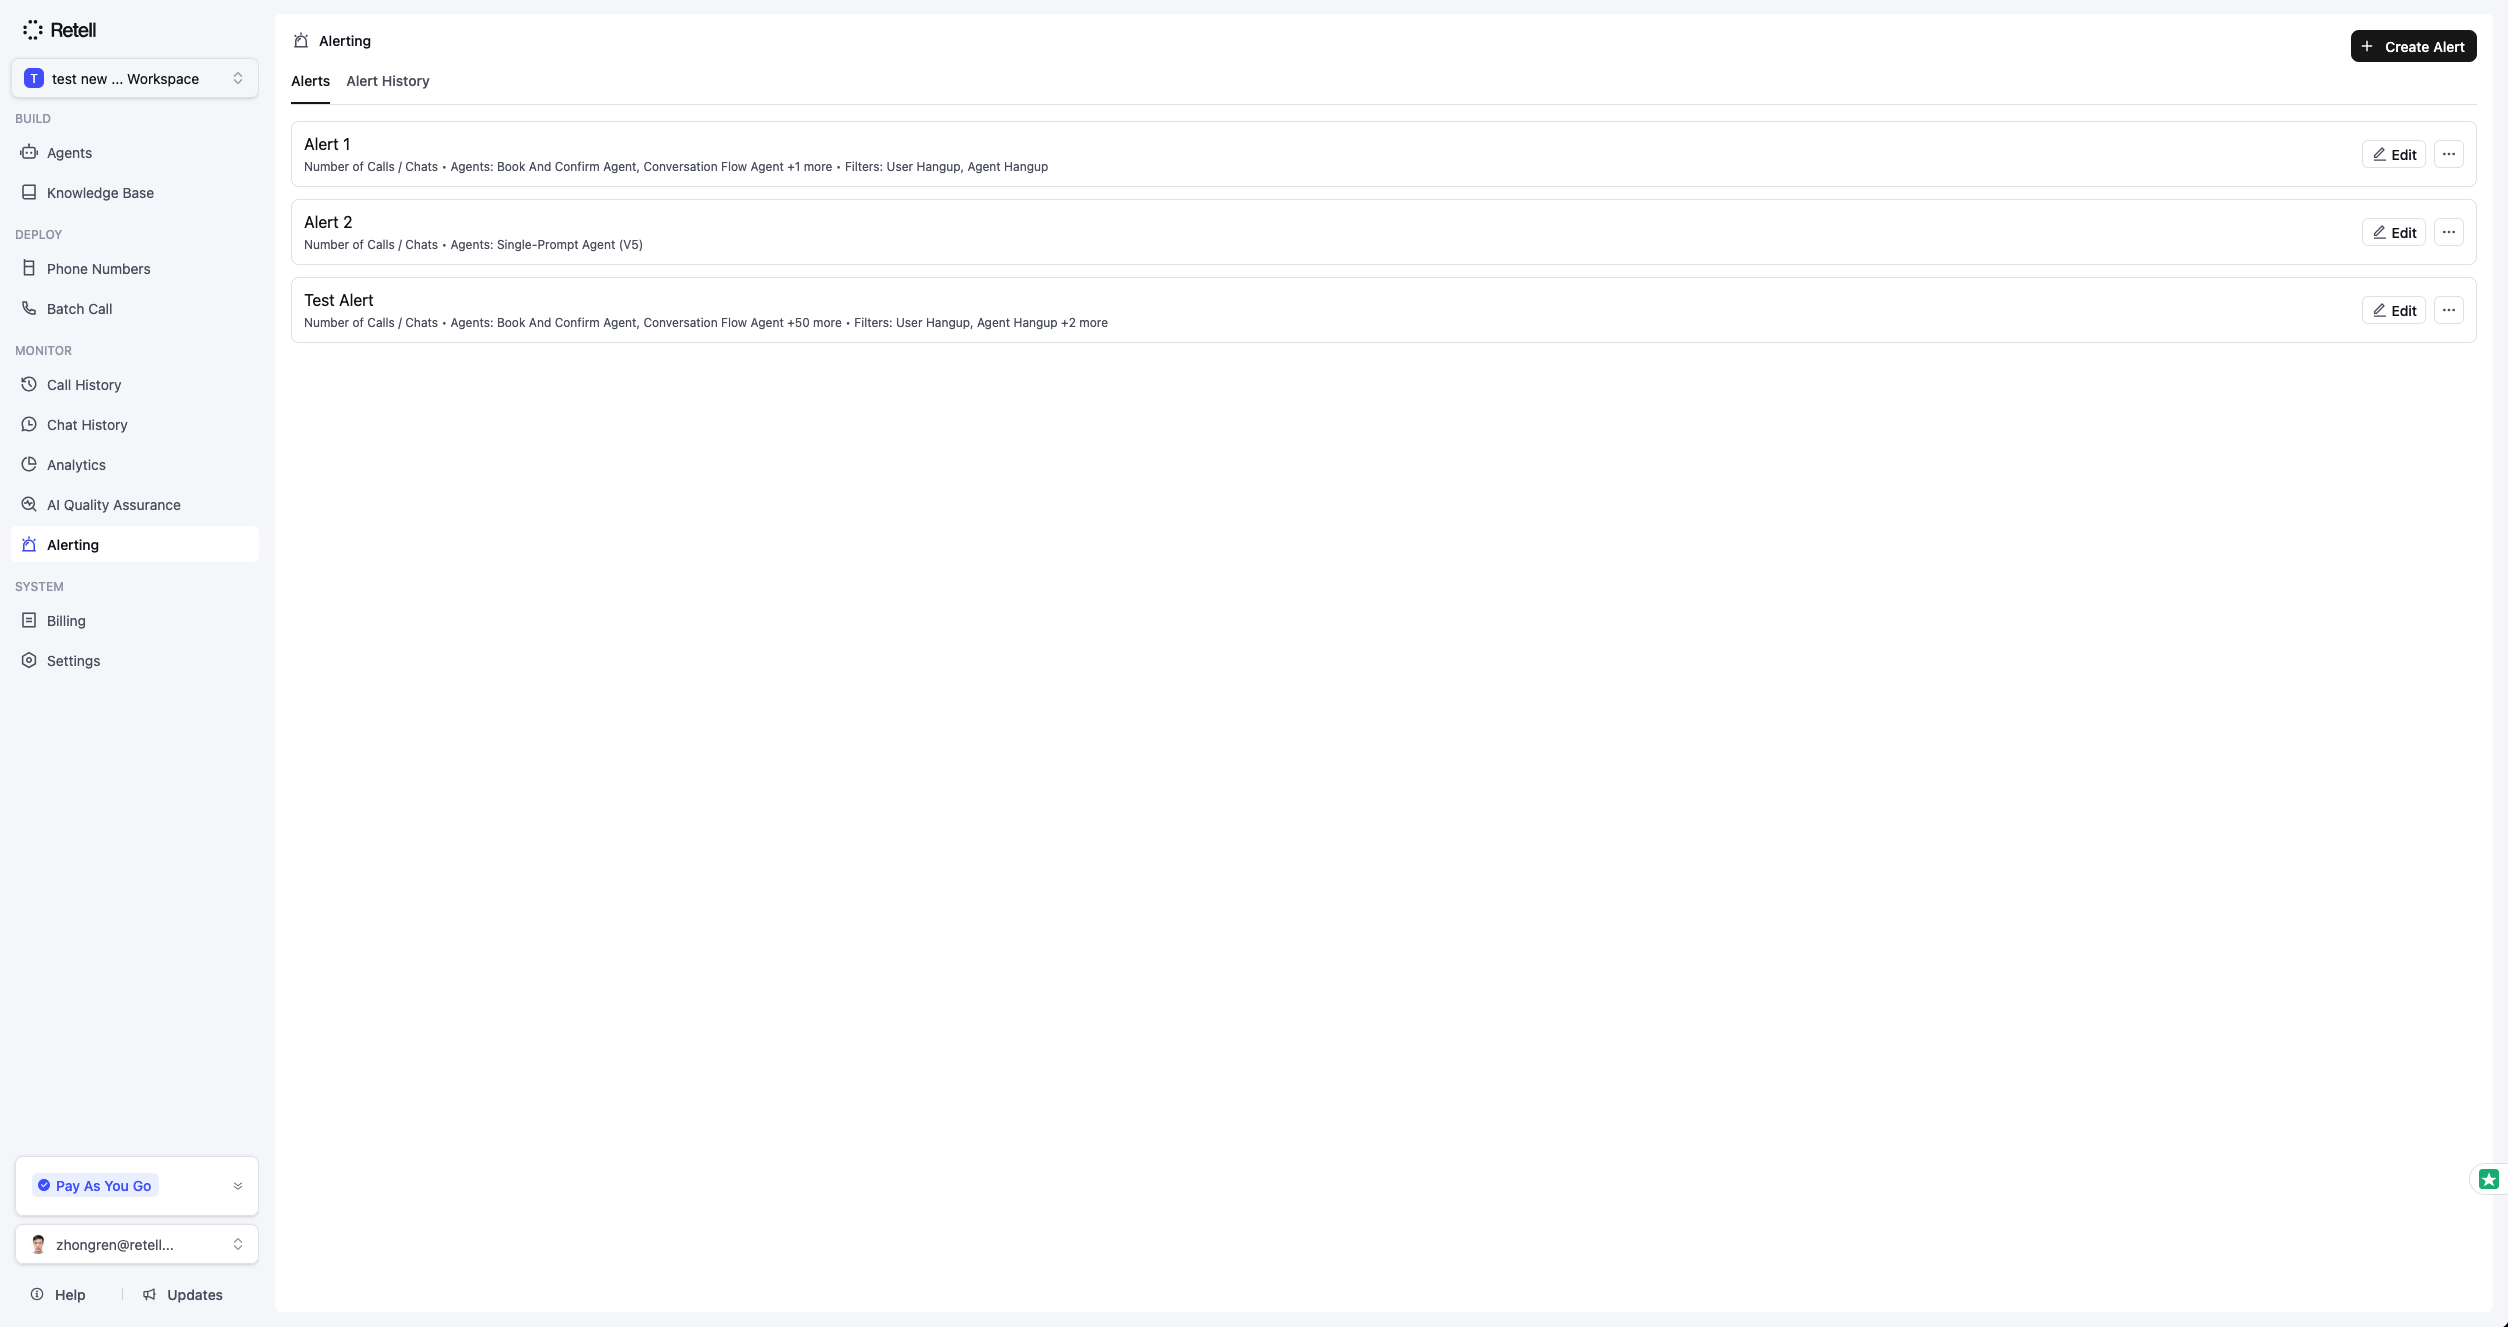
Alerting allows you to monitor your voice AI operations by creating rules that trigger notifications when specific metrics cross defined thresholds. Instead of manually checking dashboards, you receive automatic email or webhook notifications when issues arise.
 ## Use Cases
* **Monitor call volume**: Get notified when call volume spikes or drops unexpectedly
* **Track system health**: Alert when API errors or function failures increase
* **Monitor costs**: Set budget alerts when call costs exceed thresholds
* **Detect quality issues**: Alert on declining call success rates or negative sentiment
## Available Metrics
You can create alerts for the following metrics:
| Metric | Description |
| ----------------------------- | --------------------------------------------------------- |
| Call Count | Total number of calls within the evaluation window |
| Concurrency Used | Peak number of concurrent calls |
| Call Success Rate | Percentage of successful calls (0-100%) |
| Negative Sentiment Rate | Percentage of calls with negative sentiment (0-100%) |
| Custom Function Latency | Average latency of custom function calls (milliseconds) |
| Custom Function Failure Count | Number of failed custom function calls |
| Transfer Call Failure Count | Number of failed call transfers |
| QA Not Passed Count | Number of analyzed calls in a QA cohort that did not pass |
| Total Call Cost | Total cost of calls (USD) |
| API Error Count | Number of API errors (can be filtered by error code) |
## Creating an Alert Rule
Navigate to the **Alerting** tab in your dashboard to create alert rules.
## Use Cases
* **Monitor call volume**: Get notified when call volume spikes or drops unexpectedly
* **Track system health**: Alert when API errors or function failures increase
* **Monitor costs**: Set budget alerts when call costs exceed thresholds
* **Detect quality issues**: Alert on declining call success rates or negative sentiment
## Available Metrics
You can create alerts for the following metrics:
| Metric | Description |
| ----------------------------- | --------------------------------------------------------- |
| Call Count | Total number of calls within the evaluation window |
| Concurrency Used | Peak number of concurrent calls |
| Call Success Rate | Percentage of successful calls (0-100%) |
| Negative Sentiment Rate | Percentage of calls with negative sentiment (0-100%) |
| Custom Function Latency | Average latency of custom function calls (milliseconds) |
| Custom Function Failure Count | Number of failed custom function calls |
| Transfer Call Failure Count | Number of failed call transfers |
| QA Not Passed Count | Number of analyzed calls in a QA cohort that did not pass |
| Total Call Cost | Total cost of calls (USD) |
| API Error Count | Number of API errors (can be filtered by error code) |
## Creating an Alert Rule
Navigate to the **Alerting** tab in your dashboard to create alert rules.
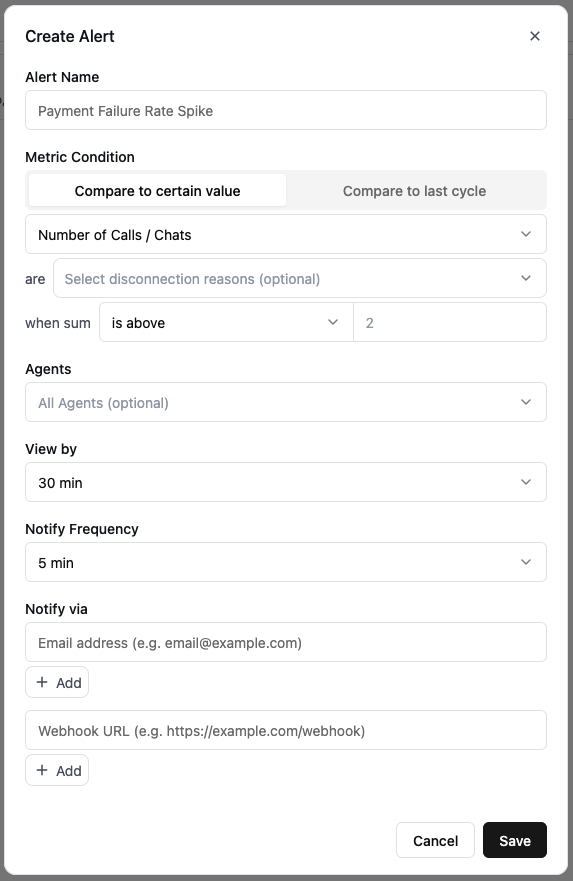 Each alert rule requires:
1. **Name**: A descriptive name for the alert
2. **Metric**: The metric to monitor
3. **Threshold type**: Absolute or relative comparison
4. **Threshold value**: The value to compare against
5. **Comparator**: Greater than, less than, etc.
6. **Evaluation window**: Time period for metric aggregation
7. **Frequency**: How often to evaluate the rule
8. **Notification channels**: Email addresses and/or webhook URLs
## Threshold Types
### Absolute Threshold
Compares the current metric value directly against your threshold.
**Example**: Alert when `Call Count > 100` in the last hour.
### Relative Threshold
Compares the percentage change from the previous period against your threshold. Useful for detecting sudden spikes or drops.
**Example**: Alert when `Call Count` increases by more than 50% compared to the previous hour.
The formula used: `((currentValue - previousValue) / previousValue) * 100`
If the previous period had zero calls but the current period has calls, this is treated as an infinite increase and will trigger alerts with `>` or `>=` comparators.
## Evaluation Windows and Frequencies
The evaluation window determines how far back to look when calculating the metric. The frequency determines how often the rule is checked.
| Window | Supported Frequencies |
| ---------- | ----------------------------- |
| 1 minute | 1 minute |
| 5 minutes | 1 minute, 5 minutes |
| 30 minutes | 5 minutes, 30 minutes |
| 1 hour | 5 minutes, 30 minutes, 1 hour |
| 12 hours | 30 minutes, 1 hour, 12 hours |
| 24 hours | 1 hour, 12 hours, 24 hours |
| 3 days | 12 hours, 24 hours |
| 7 days | 24 hours |
Choose a frequency that balances responsiveness with noise. A 1-minute frequency catches issues quickly but may trigger on brief spikes.
## Filters
You can filter the data included in metric calculations:
### Agent Filter
Filter by specific agents and optionally by agent versions.
### Disconnection Reason Filter
Filter calls by their disconnection reason (e.g., `user_hangup`, `agent_hangup`).
### Error Code Filter
For the **API Error Count** metric, filter by specific HTTP status codes (e.g., `429`, `402`).
### QA Cohort Filter
For the **QA Not Passed Count** metric, select the QA cohort to monitor.
## Notification Channels
### Email Notifications
Add email addresses to receive alert notifications. When an alert triggers, all configured recipients receive an email containing:
* Alert rule name
* Metric type
* Current value
* Threshold that was breached
* Timestamp
### Webhook Notifications
Configure webhook URLs to receive programmatic notifications. This enables integration with external monitoring systems, Slack, PagerDuty, or custom workflows.
#### Webhook Payload
Webhooks send a `POST` request with the following payload structure:
```json theme={null}
{
"event": "alert_triggered",
"alert": {
"alert_incident_id": "abc123def456...",
"alert_rule_id": "alert_rule_xyz789...",
"name": "High Call Volume Alert",
"metric_type": "call_count",
"threshold_type": "absolute",
"threshold_value": 100,
"comparator": ">",
"frequency": "1h",
"window": "1h",
"current_value": 150,
"triggered_timestamp": 1714608475945
}
}
```
#### Webhook Signature Verification
All webhook requests include an `X-Retell-Signature` header containing an HMAC-SHA256 signature. Use your organization's webhook key to verify the payload authenticity.
```typescript Node theme={null}
import Retell from 'retell-sdk';
// Verify the webhook signature
const isValid = Retell.verify(
JSON.stringify(payload),
apiKey,
signature // from X-Retell-Signature header
);
```
```python Python theme={null}
from retell import Retell
# Verify the webhook signature
is_valid = Retell.verify(
json.dumps(payload),
api_key,
signature # from X-Retell-Signature header
)
```
Always verify webhook signatures in production to ensure requests originate from Retell.
## Alert Incidents
When an alert rule's condition is met, an **alert incident** is created. Incidents track:
* When the alert was triggered
* The metric value that triggered it
* When the alert was resolved (if applicable)
Each alert rule requires:
1. **Name**: A descriptive name for the alert
2. **Metric**: The metric to monitor
3. **Threshold type**: Absolute or relative comparison
4. **Threshold value**: The value to compare against
5. **Comparator**: Greater than, less than, etc.
6. **Evaluation window**: Time period for metric aggregation
7. **Frequency**: How often to evaluate the rule
8. **Notification channels**: Email addresses and/or webhook URLs
## Threshold Types
### Absolute Threshold
Compares the current metric value directly against your threshold.
**Example**: Alert when `Call Count > 100` in the last hour.
### Relative Threshold
Compares the percentage change from the previous period against your threshold. Useful for detecting sudden spikes or drops.
**Example**: Alert when `Call Count` increases by more than 50% compared to the previous hour.
The formula used: `((currentValue - previousValue) / previousValue) * 100`
If the previous period had zero calls but the current period has calls, this is treated as an infinite increase and will trigger alerts with `>` or `>=` comparators.
## Evaluation Windows and Frequencies
The evaluation window determines how far back to look when calculating the metric. The frequency determines how often the rule is checked.
| Window | Supported Frequencies |
| ---------- | ----------------------------- |
| 1 minute | 1 minute |
| 5 minutes | 1 minute, 5 minutes |
| 30 minutes | 5 minutes, 30 minutes |
| 1 hour | 5 minutes, 30 minutes, 1 hour |
| 12 hours | 30 minutes, 1 hour, 12 hours |
| 24 hours | 1 hour, 12 hours, 24 hours |
| 3 days | 12 hours, 24 hours |
| 7 days | 24 hours |
Choose a frequency that balances responsiveness with noise. A 1-minute frequency catches issues quickly but may trigger on brief spikes.
## Filters
You can filter the data included in metric calculations:
### Agent Filter
Filter by specific agents and optionally by agent versions.
### Disconnection Reason Filter
Filter calls by their disconnection reason (e.g., `user_hangup`, `agent_hangup`).
### Error Code Filter
For the **API Error Count** metric, filter by specific HTTP status codes (e.g., `429`, `402`).
### QA Cohort Filter
For the **QA Not Passed Count** metric, select the QA cohort to monitor.
## Notification Channels
### Email Notifications
Add email addresses to receive alert notifications. When an alert triggers, all configured recipients receive an email containing:
* Alert rule name
* Metric type
* Current value
* Threshold that was breached
* Timestamp
### Webhook Notifications
Configure webhook URLs to receive programmatic notifications. This enables integration with external monitoring systems, Slack, PagerDuty, or custom workflows.
#### Webhook Payload
Webhooks send a `POST` request with the following payload structure:
```json theme={null}
{
"event": "alert_triggered",
"alert": {
"alert_incident_id": "abc123def456...",
"alert_rule_id": "alert_rule_xyz789...",
"name": "High Call Volume Alert",
"metric_type": "call_count",
"threshold_type": "absolute",
"threshold_value": 100,
"comparator": ">",
"frequency": "1h",
"window": "1h",
"current_value": 150,
"triggered_timestamp": 1714608475945
}
}
```
#### Webhook Signature Verification
All webhook requests include an `X-Retell-Signature` header containing an HMAC-SHA256 signature. Use your organization's webhook key to verify the payload authenticity.
```typescript Node theme={null}
import Retell from 'retell-sdk';
// Verify the webhook signature
const isValid = Retell.verify(
JSON.stringify(payload),
apiKey,
signature // from X-Retell-Signature header
);
```
```python Python theme={null}
from retell import Retell
# Verify the webhook signature
is_valid = Retell.verify(
json.dumps(payload),
api_key,
signature # from X-Retell-Signature header
)
```
Always verify webhook signatures in production to ensure requests originate from Retell.
## Alert Incidents
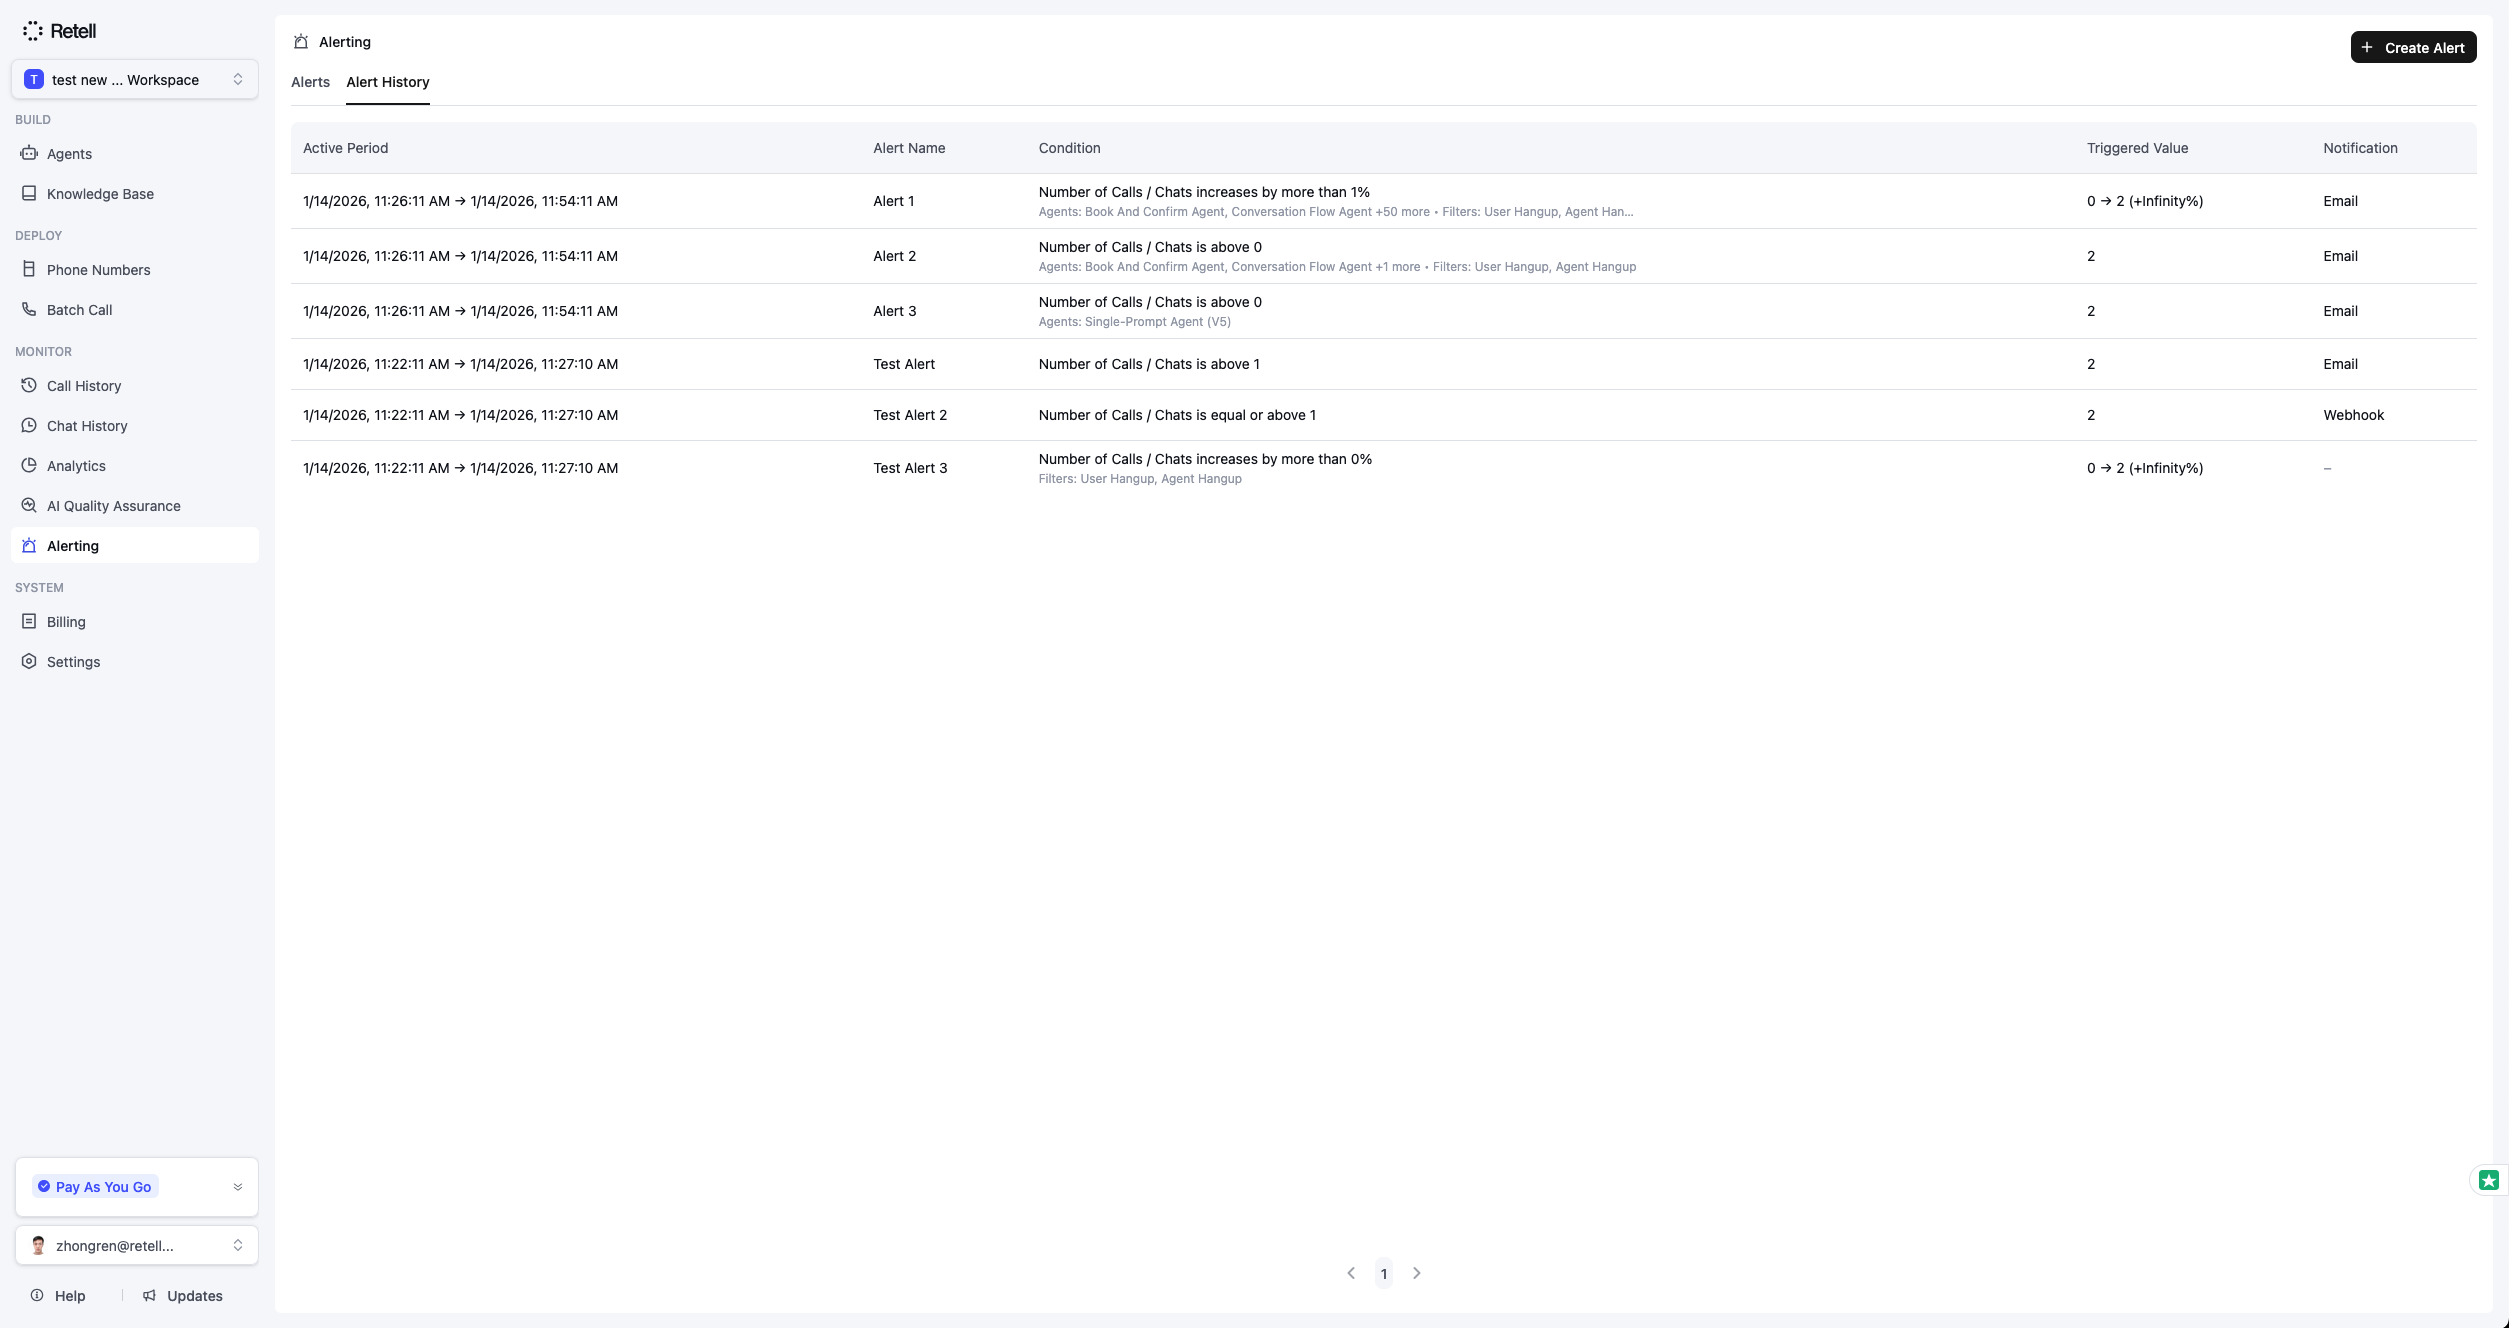
When an alert rule's condition is met, an **alert incident** is created. Incidents track:
* When the alert was triggered
* The metric value that triggered it
* When the alert was resolved (if applicable)
 ### Incident Lifecycle
1. **Triggered**: When the metric breaches the threshold, a new incident is created and notifications are sent
2. **Active**: The incident remains active while the condition persists
3. **Resolved**: When the metric no longer breaches the threshold, the incident is marked as resolved
Only one incident can be active per alert rule at a time. Notifications are sent only when a new incident is created, not on each evaluation.
## Limits
* Maximum **10 alert rules** per organization
* Webhook timeout: **10 seconds**
## FAQ
Alerts are evaluated based on their configured frequency (1 minute to 24 hours). The system checks all due alert rules every minute and processes them according to their individual schedules.
No. Notifications are sent only once when a new incident is created. You won't receive repeated notifications while the alert condition persists. A new notification is sent only if the alert resolves and then triggers again.
When the metric no longer meets the threshold condition, the active incident is marked as resolved with a timestamp. Currently, resolution notifications are not sent automatically.
Yes. You can select multiple agents in the filter configuration. The metric will be calculated across all selected agents.
If the previous period had zero activity but the current period has activity, this is treated as an infinite increase. Alerts with `>` or `>=` comparators will trigger in this case.
### Incident Lifecycle
1. **Triggered**: When the metric breaches the threshold, a new incident is created and notifications are sent
2. **Active**: The incident remains active while the condition persists
3. **Resolved**: When the metric no longer breaches the threshold, the incident is marked as resolved
Only one incident can be active per alert rule at a time. Notifications are sent only when a new incident is created, not on each evaluation.
## Limits
* Maximum **10 alert rules** per organization
* Webhook timeout: **10 seconds**
## FAQ
Alerts are evaluated based on their configured frequency (1 minute to 24 hours). The system checks all due alert rules every minute and processes them according to their individual schedules.
No. Notifications are sent only once when a new incident is created. You won't receive repeated notifications while the alert condition persists. A new notification is sent only if the alert resolves and then triggers again.
When the metric no longer meets the threshold condition, the active incident is marked as resolved with a timestamp. Currently, resolution notifications are not sent automatically.
Yes. You can select multiple agents in the filter configuration. The metric will be calculated across all selected agents.
If the previous period had zero activity but the current period has activity, this is treated as an infinite increase. Alerts with `>` or `>=` comparators will trigger in this case.