> ## Documentation Index
> Fetch the complete documentation index at: https://docs.retellai.com/llms.txt
> Use this file to discover all available pages before exploring further.
# Build and customize the analytics dashboard
> Create custom analytics dashboards in Retell to track call and chat metrics with configurable charts, filters, breakdowns, and resizable visualizations.
The Analytics dashboard lets you track call, chat, and agent metrics through customizable charts. Access it from the Analytics tab.
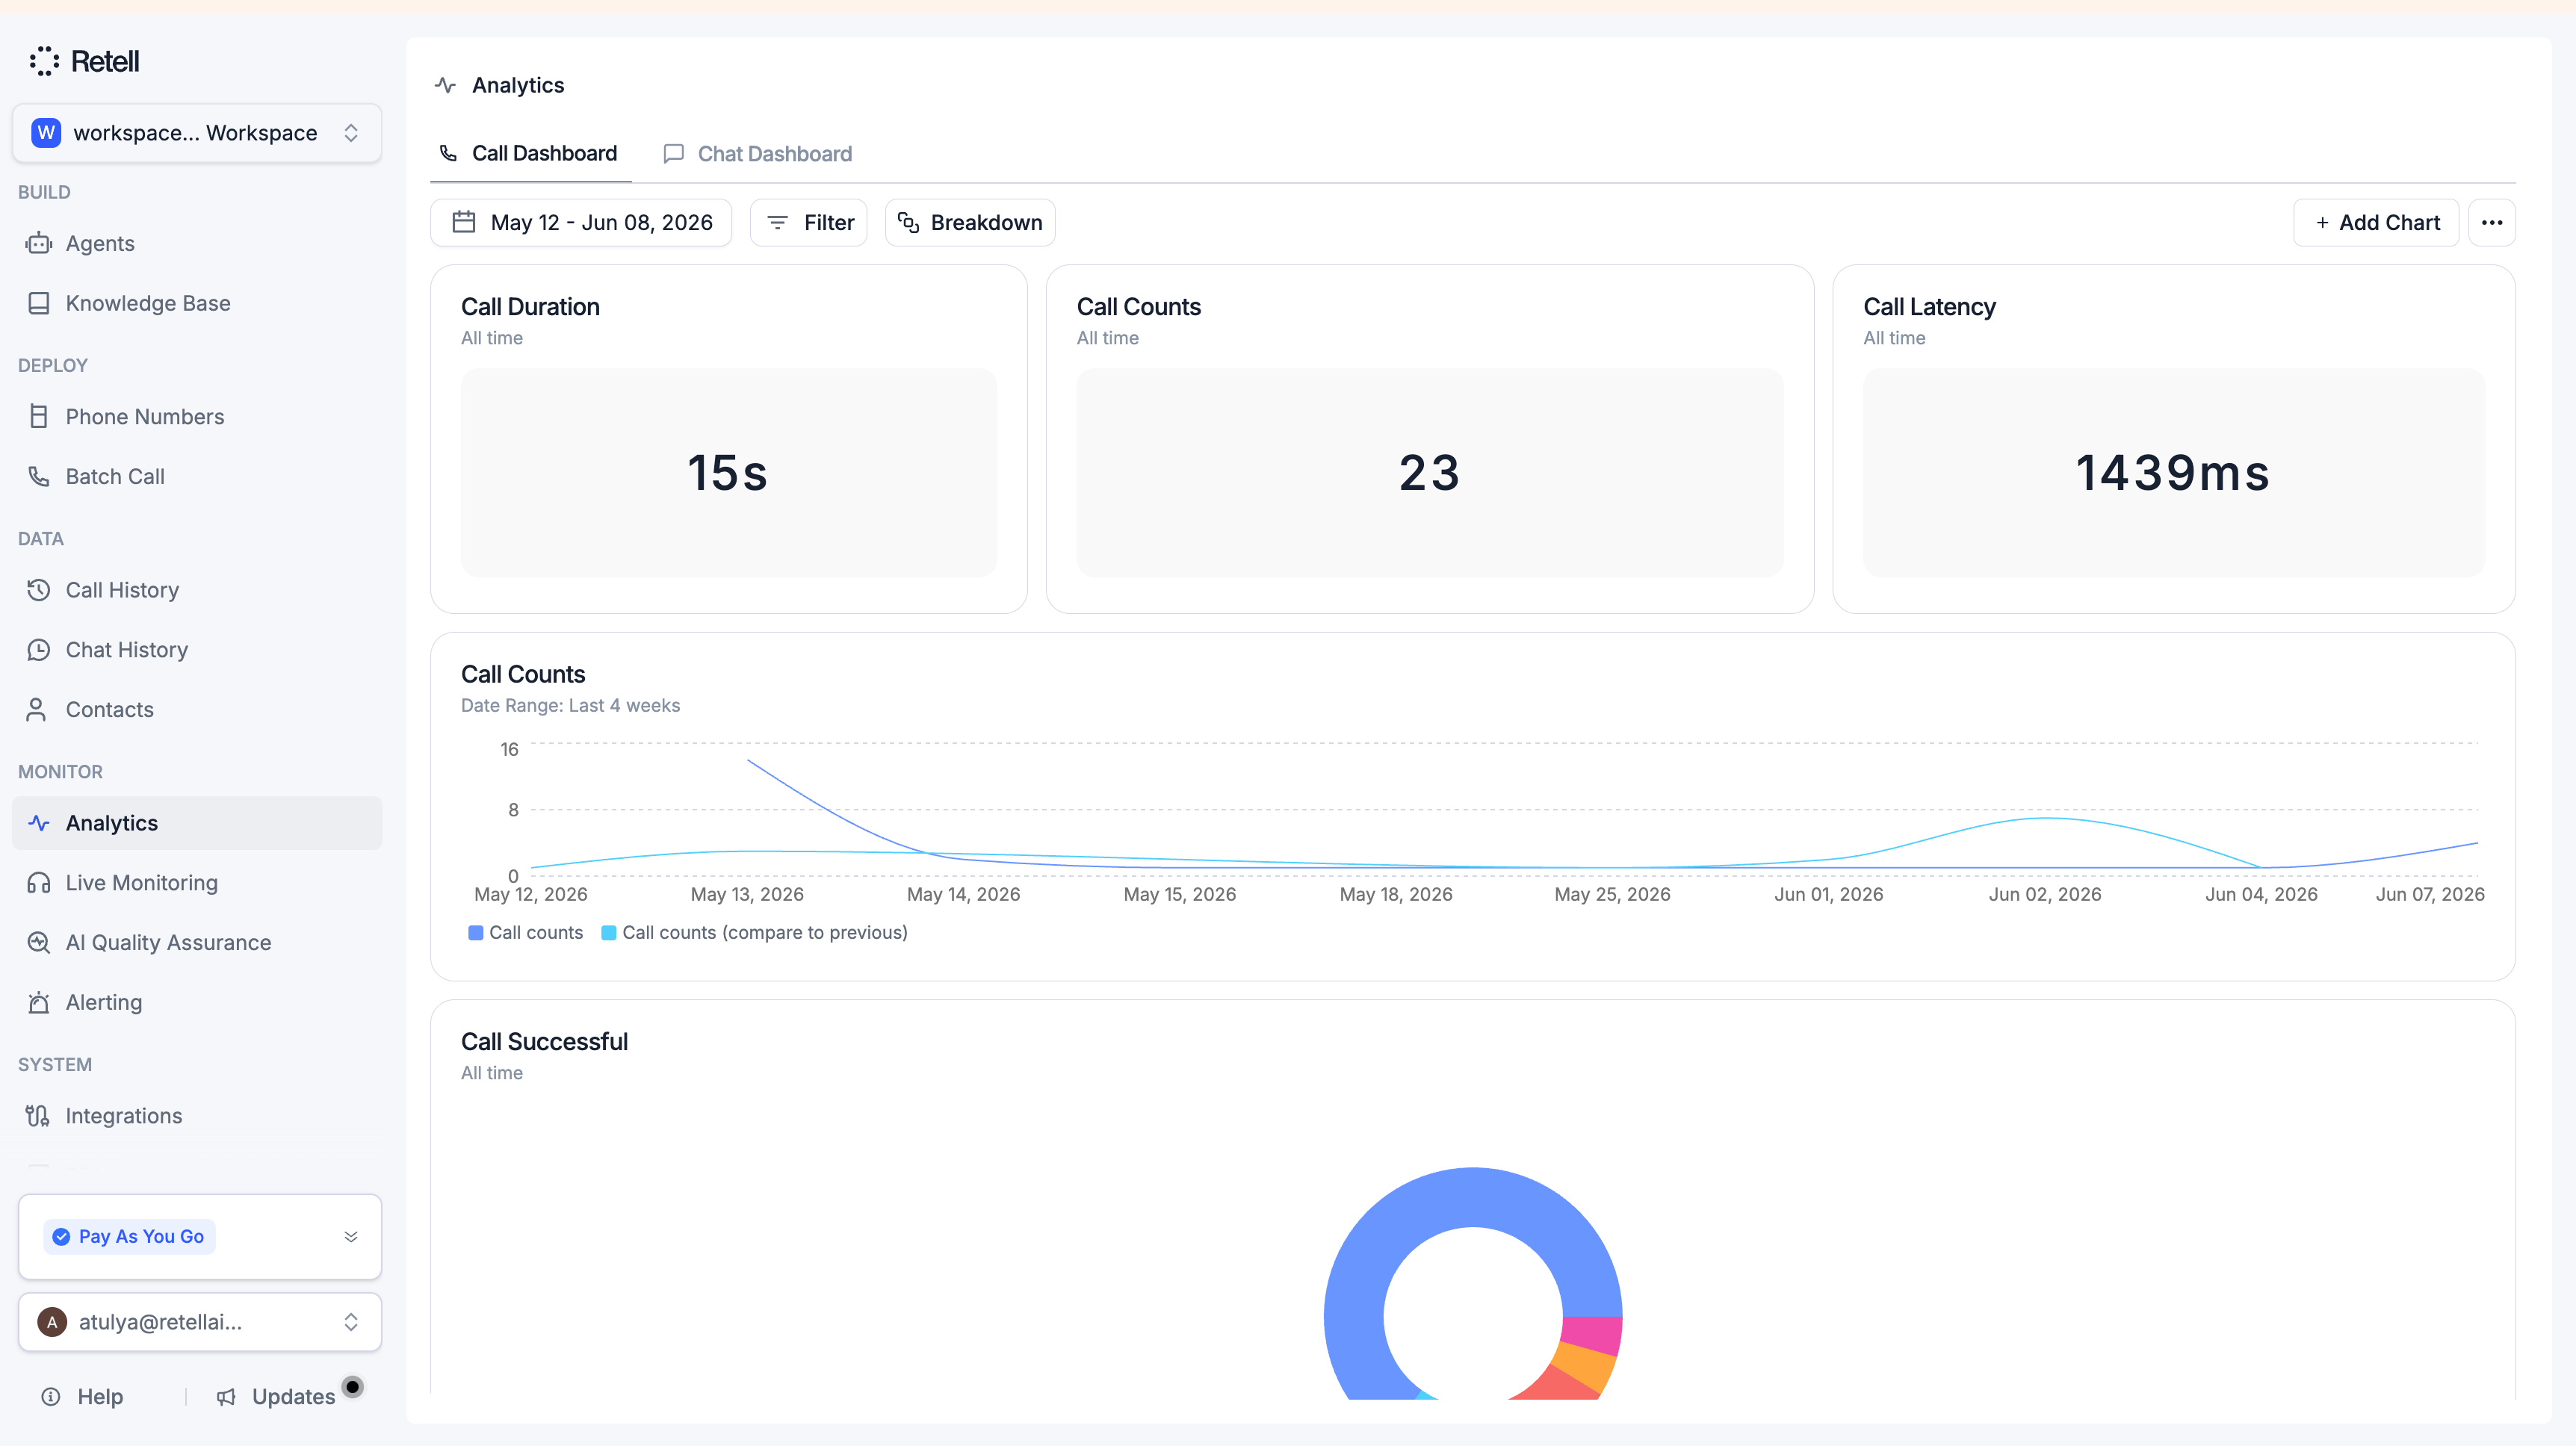 ## Multiple Dashboards
You can create up to 10 dashboards, each scoped to either call or chat data.
* **Switch** between dashboards using the tabs at the top
* **Rename** a dashboard by clicking its tab name
* **Reorder** dashboards by dragging tabs
* **Duplicate or delete** from the dashboard menu
Each dashboard has its own charts, filters, and breakdowns.
## Dashboard Management
### Charts
* **Create** new charts to track specific metrics
* **Duplicate** a chart to build quick variations
* **Drag and drop** to rearrange charts within or between rows
### Resizing
Resize charts directly on the dashboard — no need to open the editor:
* Drag the divider between charts to adjust column widths
* Drag the handle at the bottom of a row to adjust row height
* Drag a chart into an empty area to start a new row
### Global Filters and Breakdowns
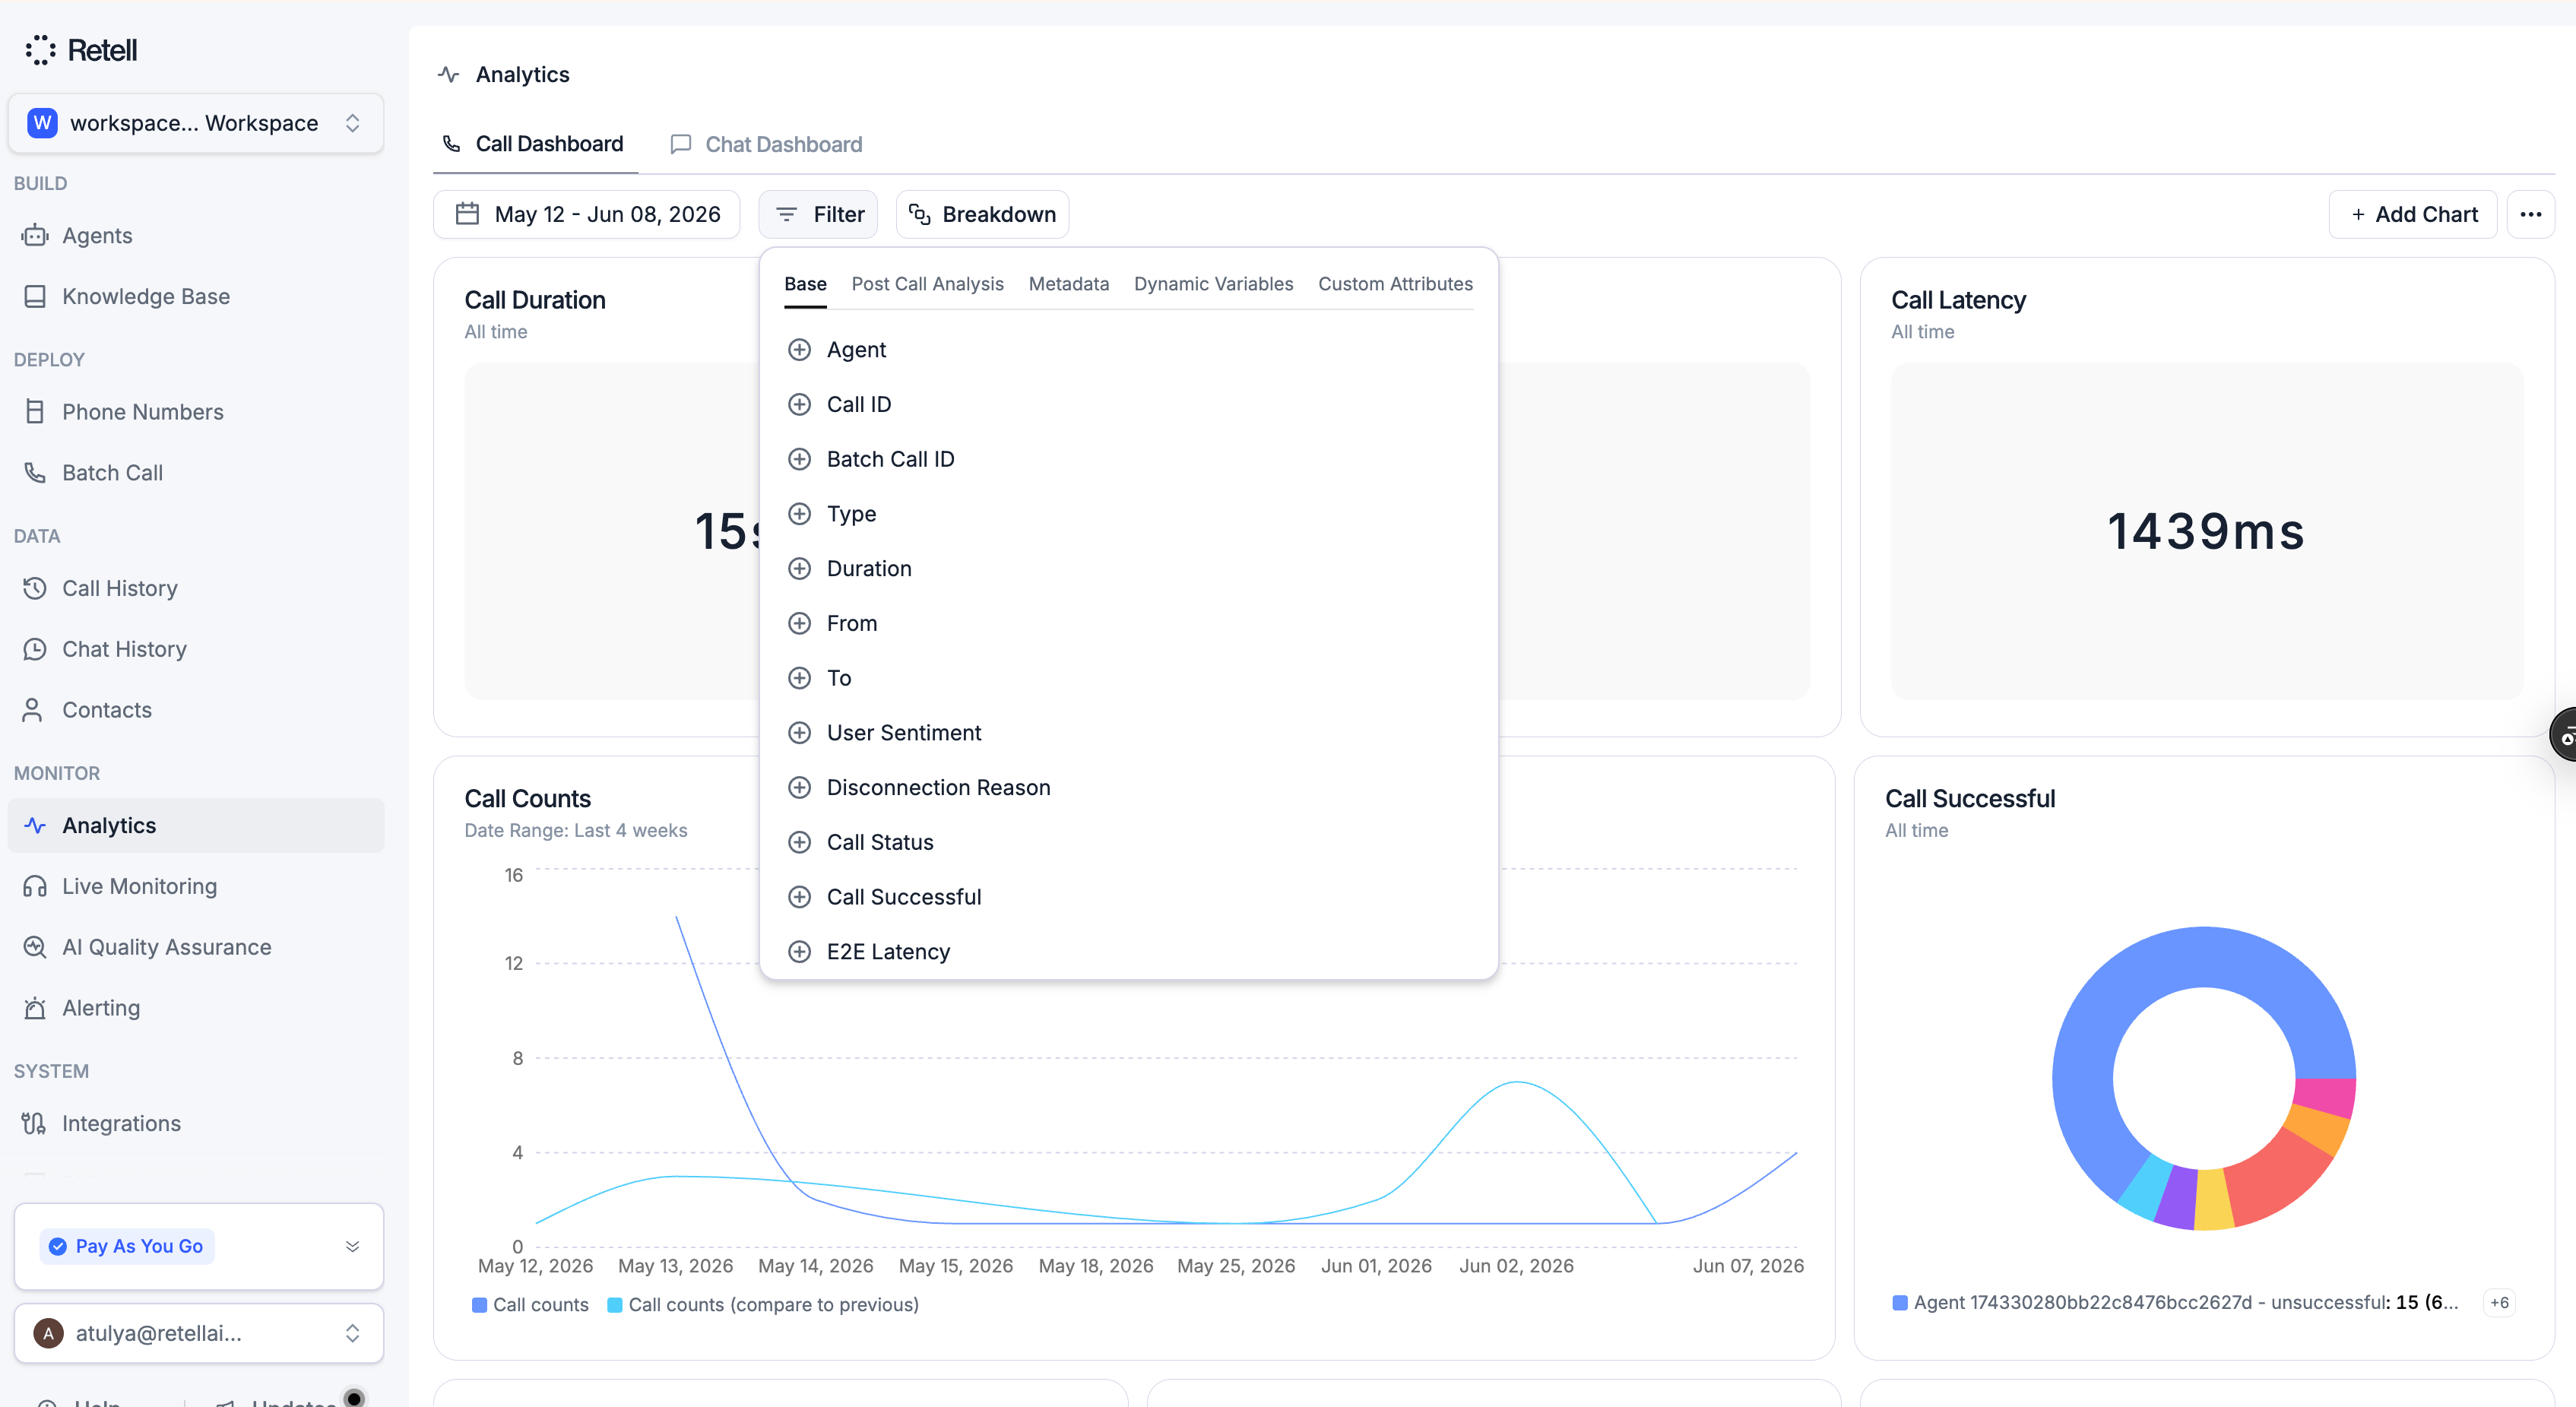
Filters and breakdowns in the header apply to all charts on the dashboard.
**Filters** — available fields depend on dashboard type:
* **Call:** agent, call type, duration, from/to number, user sentiment, disconnection reason, call status, call successful, E2E latency, post-call analysis fields, custom attributes
* **Chat:** agent, chat status, chat successful, cost, user sentiment, post-chat analysis fields, custom attributes
## Multiple Dashboards
You can create up to 10 dashboards, each scoped to either call or chat data.
* **Switch** between dashboards using the tabs at the top
* **Rename** a dashboard by clicking its tab name
* **Reorder** dashboards by dragging tabs
* **Duplicate or delete** from the dashboard menu
Each dashboard has its own charts, filters, and breakdowns.
## Dashboard Management
### Charts
* **Create** new charts to track specific metrics
* **Duplicate** a chart to build quick variations
* **Drag and drop** to rearrange charts within or between rows
### Resizing
Resize charts directly on the dashboard — no need to open the editor:
* Drag the divider between charts to adjust column widths
* Drag the handle at the bottom of a row to adjust row height
* Drag a chart into an empty area to start a new row
### Global Filters and Breakdowns
Filters and breakdowns in the header apply to all charts on the dashboard.
**Filters** — available fields depend on dashboard type:
* **Call:** agent, call type, duration, from/to number, user sentiment, disconnection reason, call status, call successful, E2E latency, post-call analysis fields, custom attributes
* **Chat:** agent, chat status, chat successful, cost, user sentiment, post-chat analysis fields, custom attributes
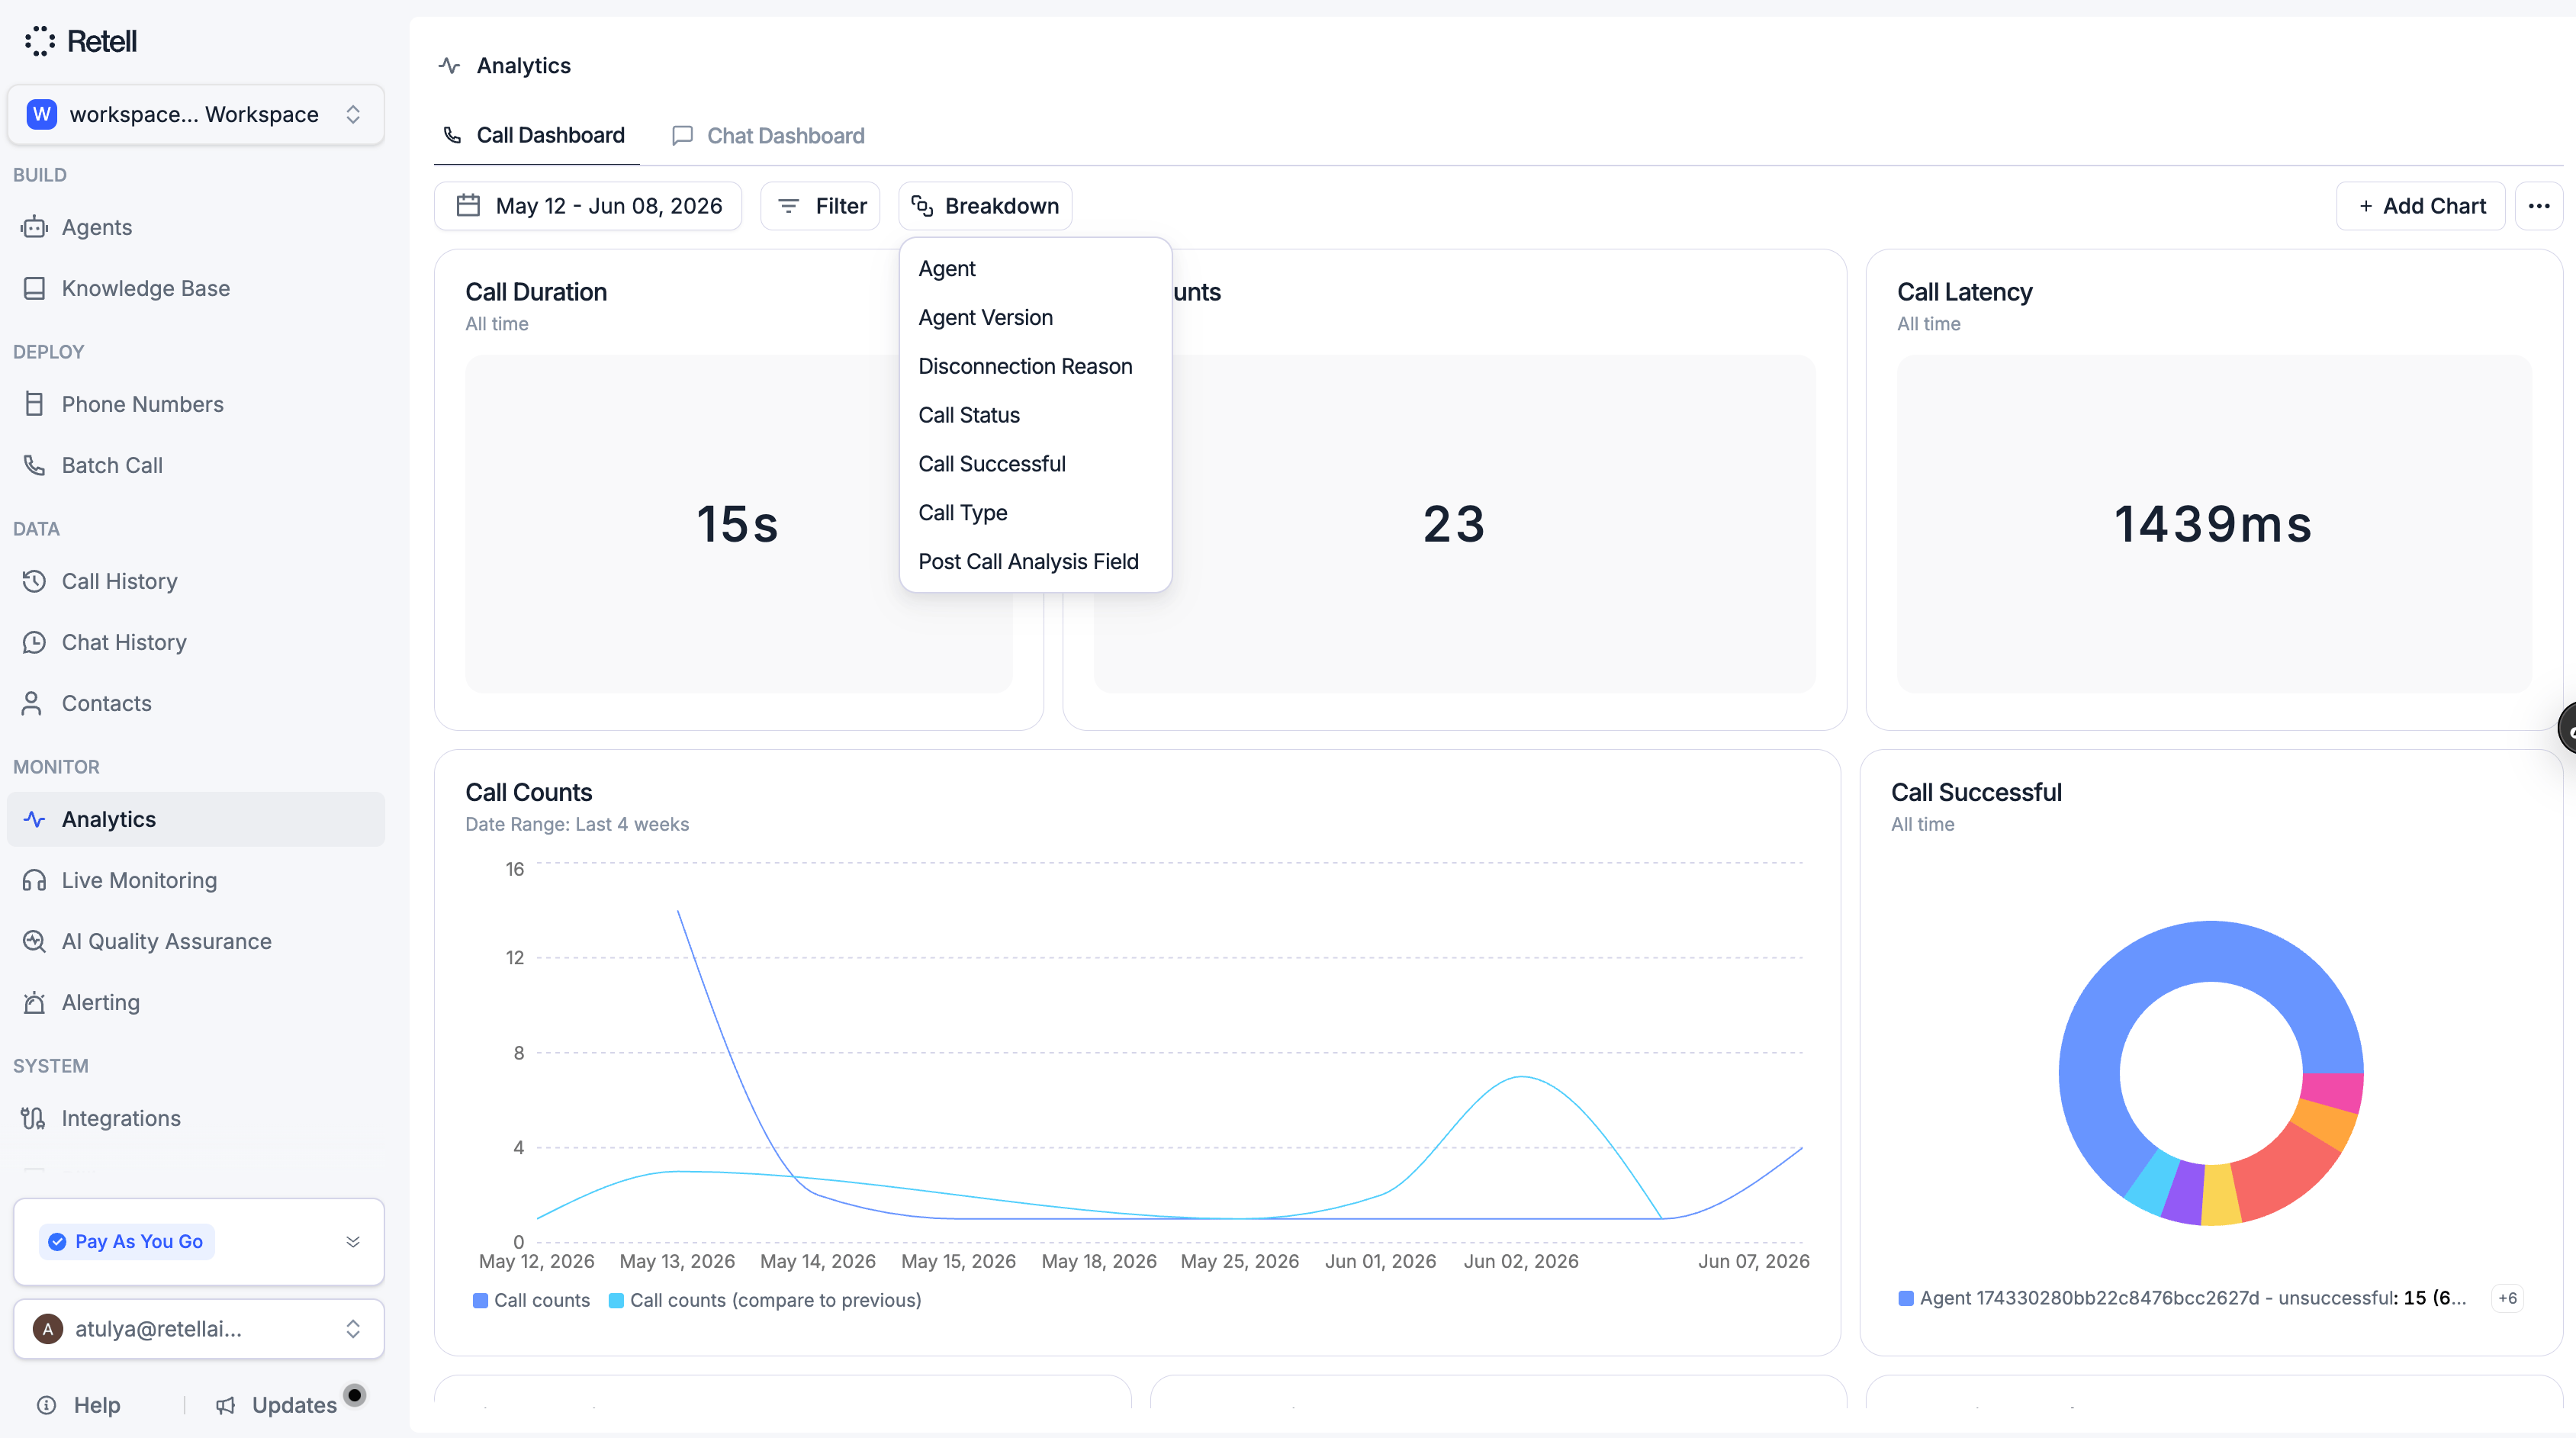
 **Breakdowns** — group all charts by one or more dimensions:
* Agent, agent version, disconnection reason, call/chat status, call/chat successful, call type, post-call/chat analysis fields
**Breakdowns** — group all charts by one or more dimensions:
* Agent, agent version, disconnection reason, call/chat status, call/chat successful, call type, post-call/chat analysis fields
 ### Saving Filters and Breakdowns
Changes to filters and breakdowns aren't saved automatically. When you make a change, a **Save** button appears — click it to persist, or **Cancel** to discard. Saved state is restored the next time you open the dashboard.
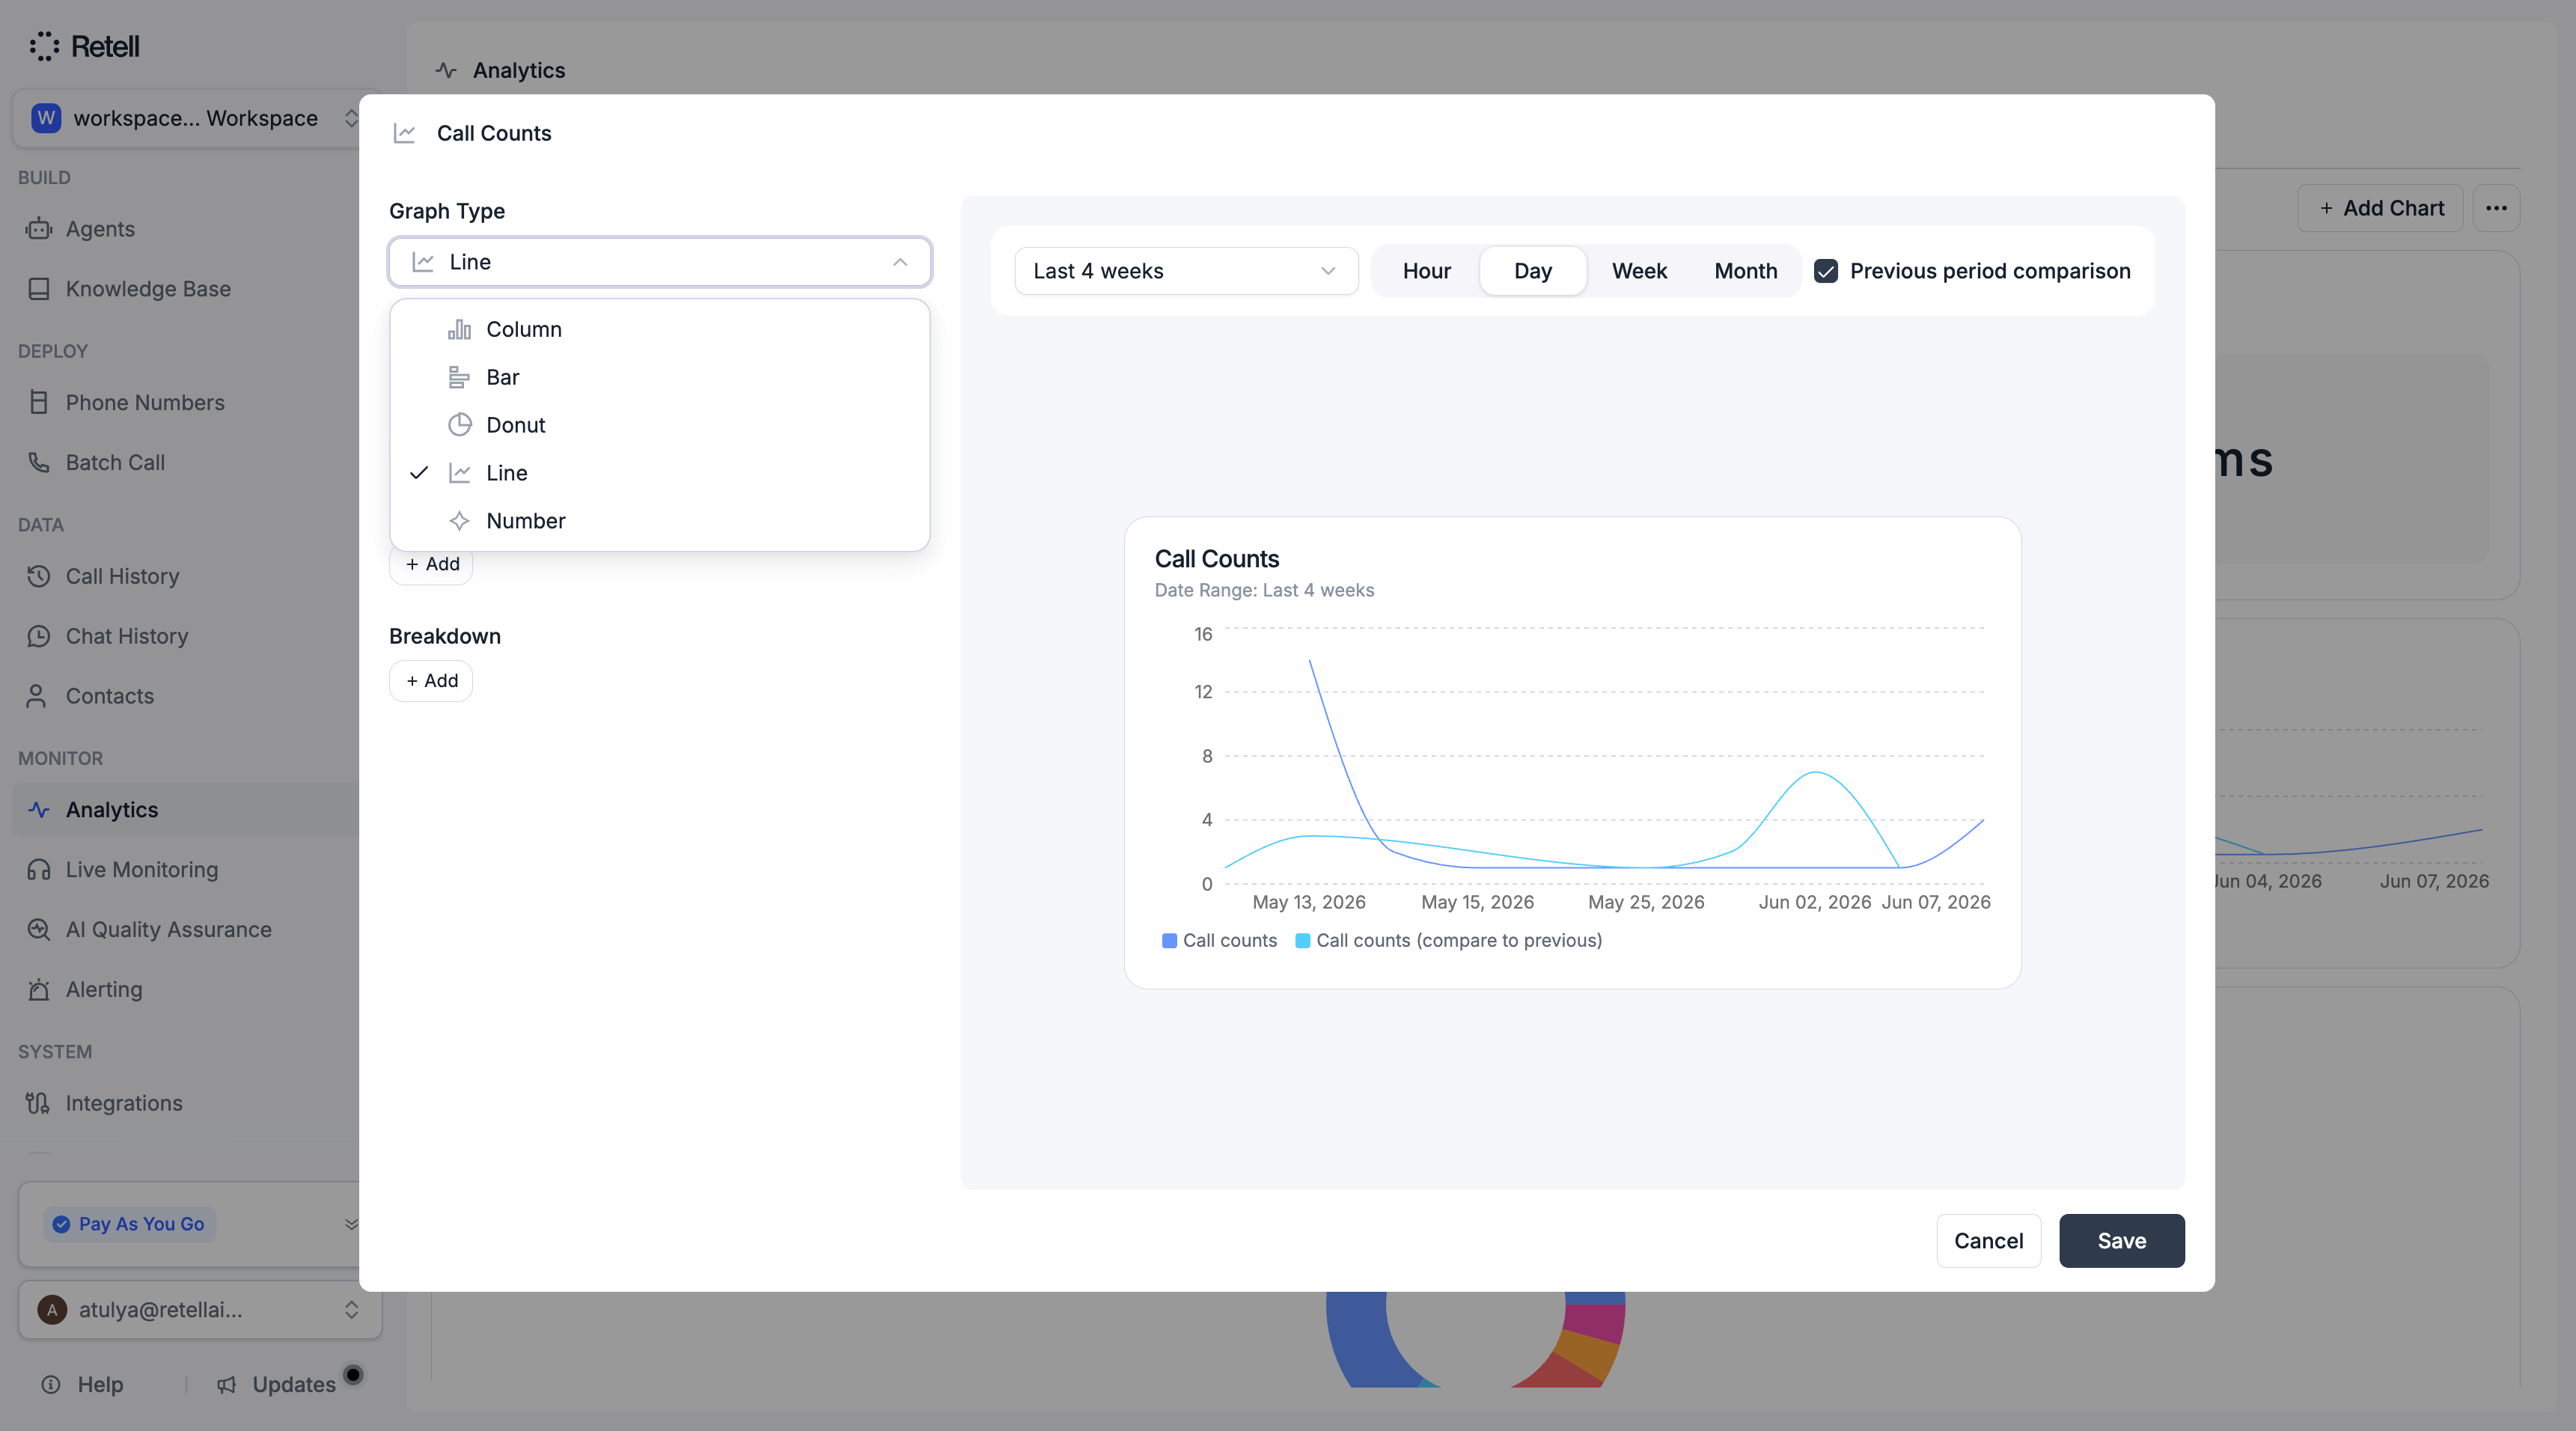
## Chart Types
* **Column** — compare values across categories
* **Bar** — horizontal comparison
* **Donut** — proportional data and percentages
* **Line** — trends over time
* **Number** — single KPI display
### Saving Filters and Breakdowns
Changes to filters and breakdowns aren't saved automatically. When you make a change, a **Save** button appears — click it to persist, or **Cancel** to discard. Saved state is restored the next time you open the dashboard.
## Chart Types
* **Column** — compare values across categories
* **Bar** — horizontal comparison
* **Donut** — proportional data and percentages
* **Line** — trends over time
* **Number** — single KPI display
 ### Per-Chart Filters and Breakdowns
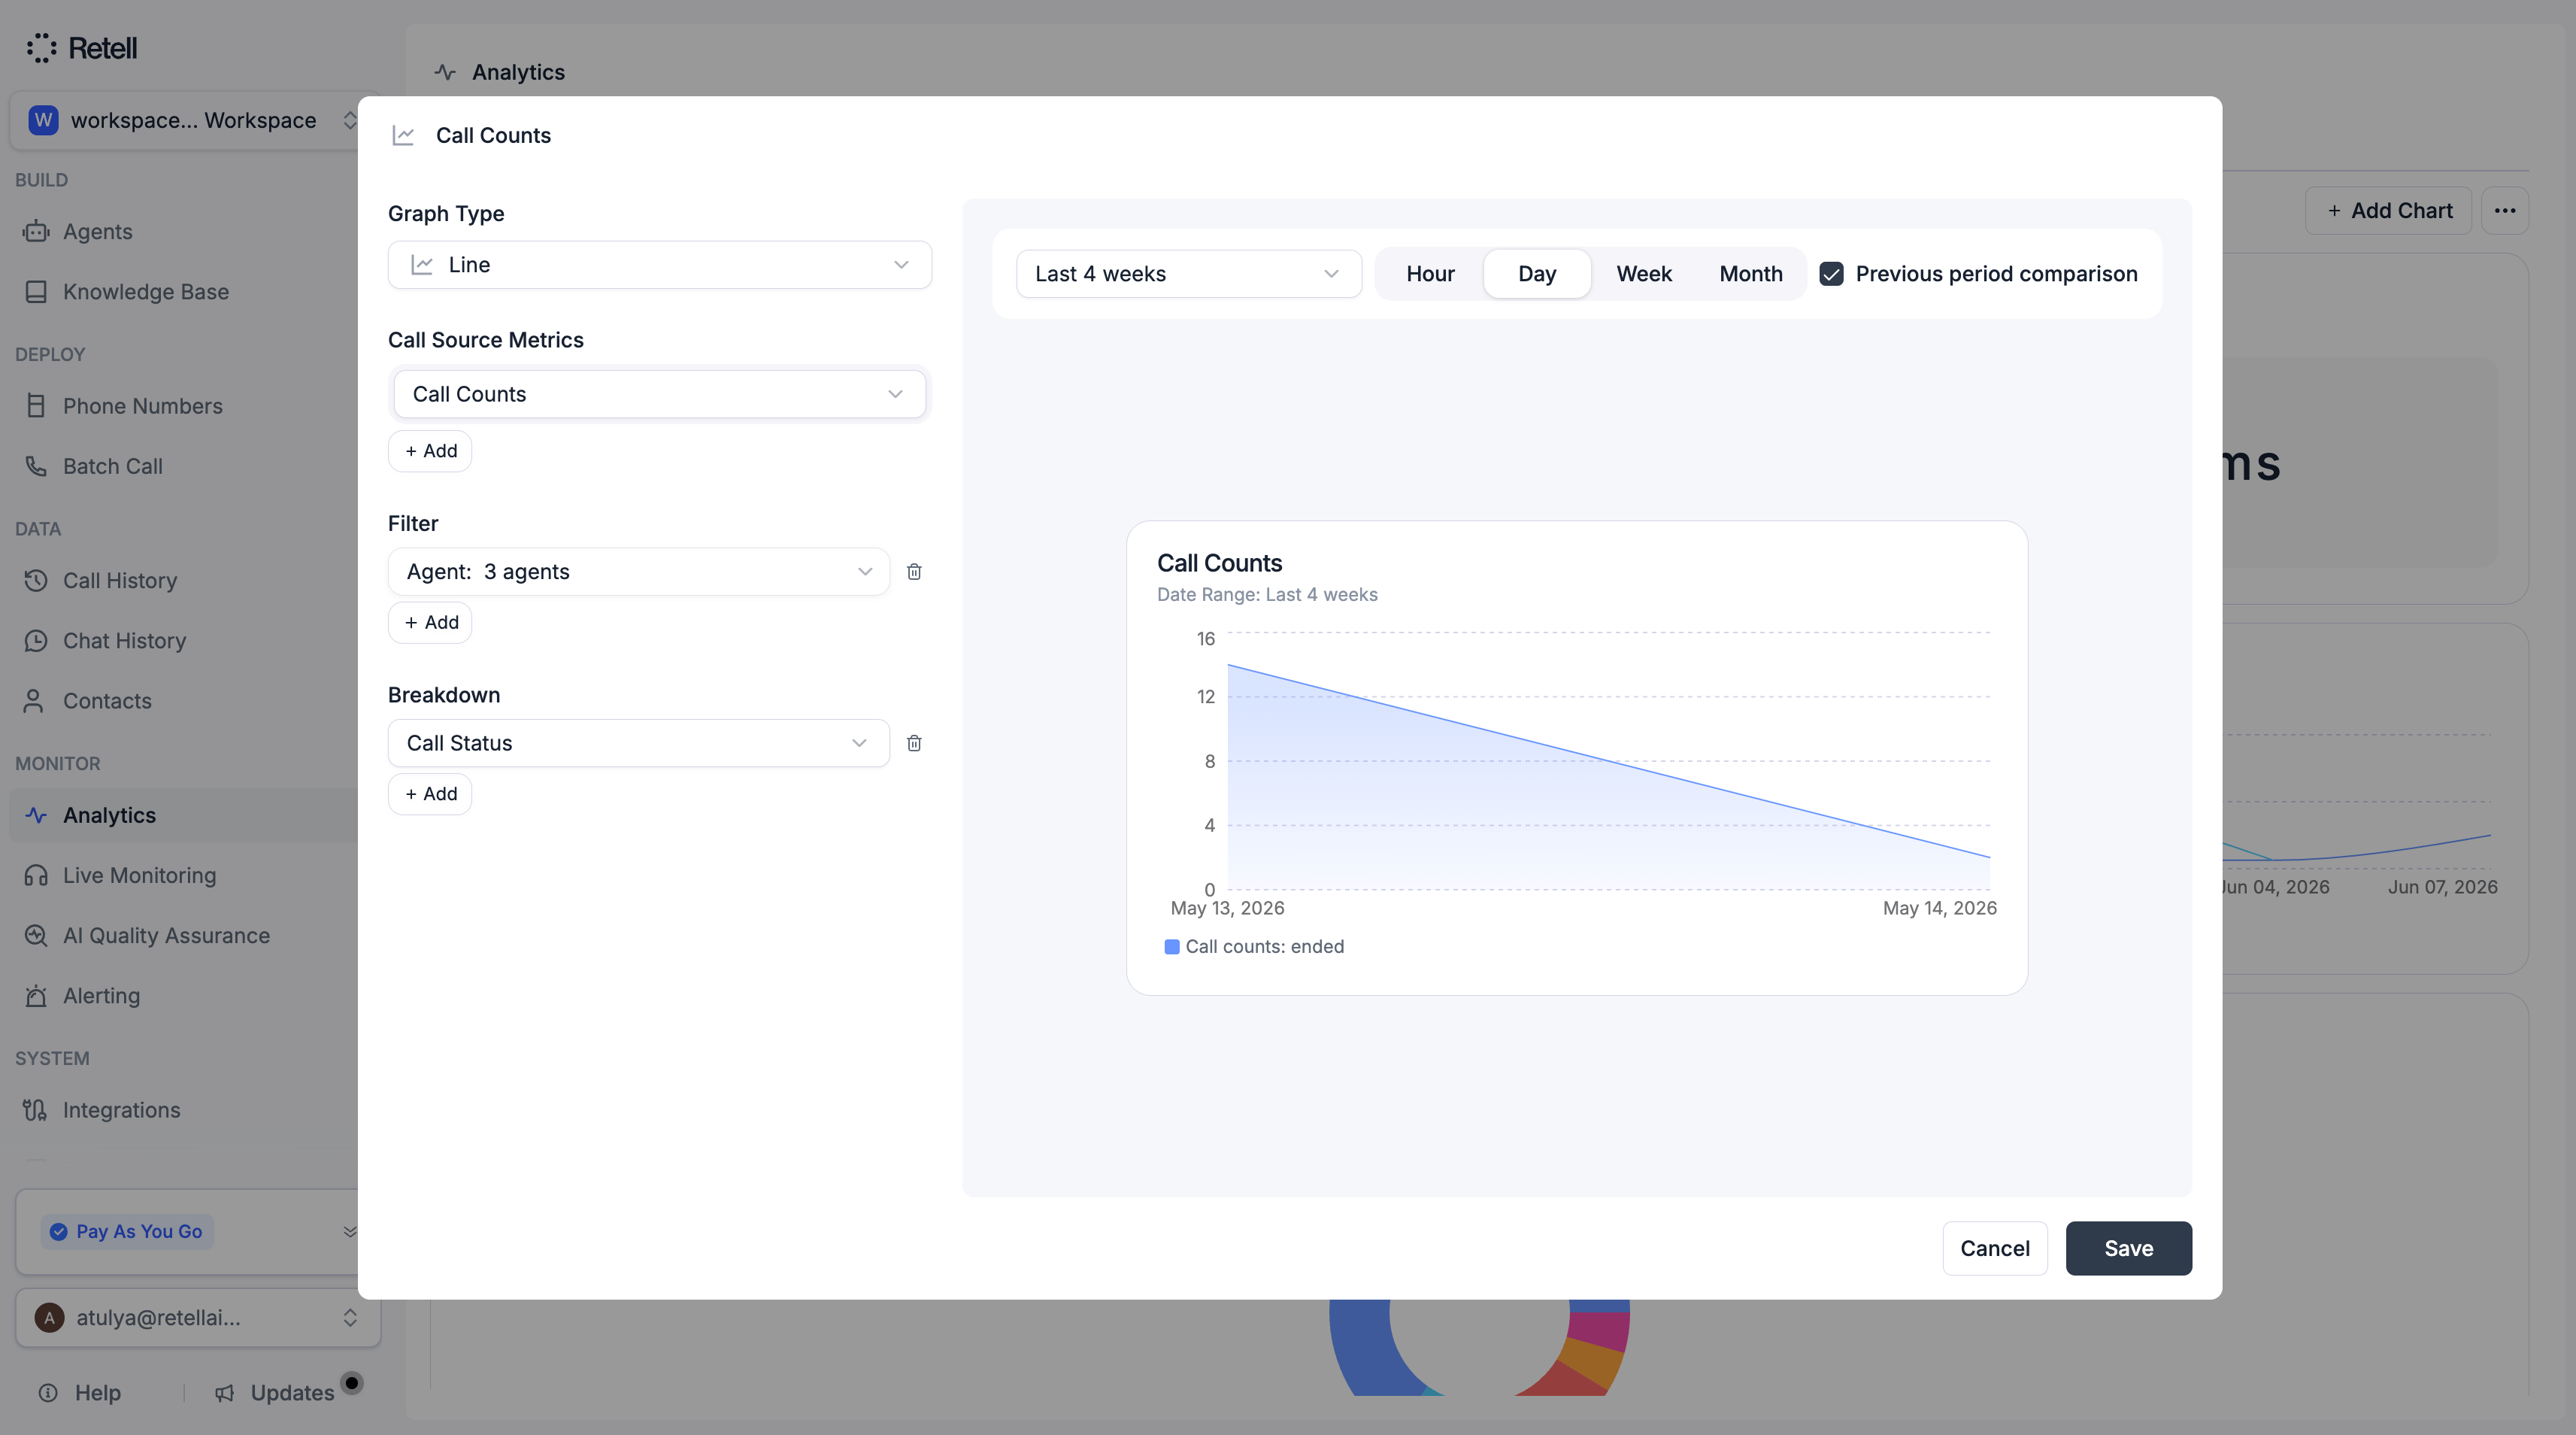
Each chart can have its own filters and breakdowns set in the chart editor, independent of the dashboard-level settings:
* **Filters** — same options as dashboard filters, applied only to this chart
* **Breakdowns** — up to 5 grouping dimensions, including post-call/chat analysis fields
* **View by** — set the time unit (day, week, month, year) and toggle previous period comparison
Per-chart filters are merged with dashboard filters when data is fetched.
### Per-Chart Filters and Breakdowns
Each chart can have its own filters and breakdowns set in the chart editor, independent of the dashboard-level settings:
* **Filters** — same options as dashboard filters, applied only to this chart
* **Breakdowns** — up to 5 grouping dimensions, including post-call/chat analysis fields
* **View by** — set the time unit (day, week, month, year) and toggle previous period comparison
Per-chart filters are merged with dashboard filters when data is fetched.
 ### Custom Post-Call Analysis
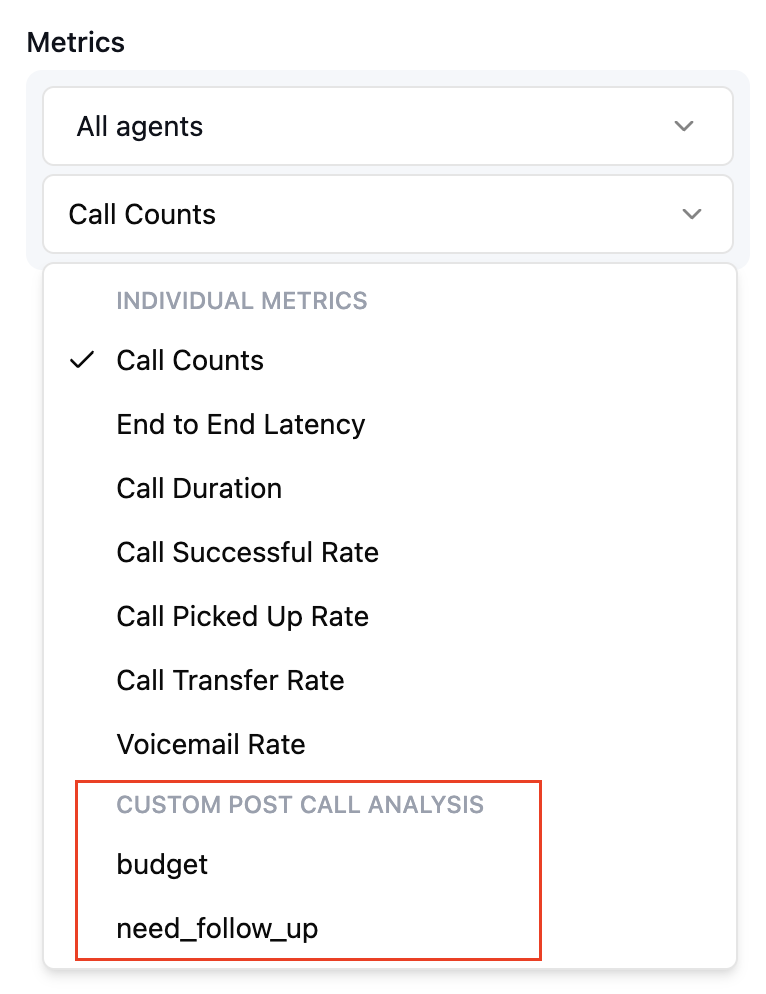
Charts can be built from any field in your [custom post-call analysis](/features/post-call-analysis-create), so you can track business-specific outcomes alongside standard metrics.
### Custom Post-Call Analysis
Charts can be built from any field in your [custom post-call analysis](/features/post-call-analysis-create), so you can track business-specific outcomes alongside standard metrics.
 ## FAQ
**Analytics data is updated in real-time.**
## FAQ
**Analytics data is updated in real-time.**
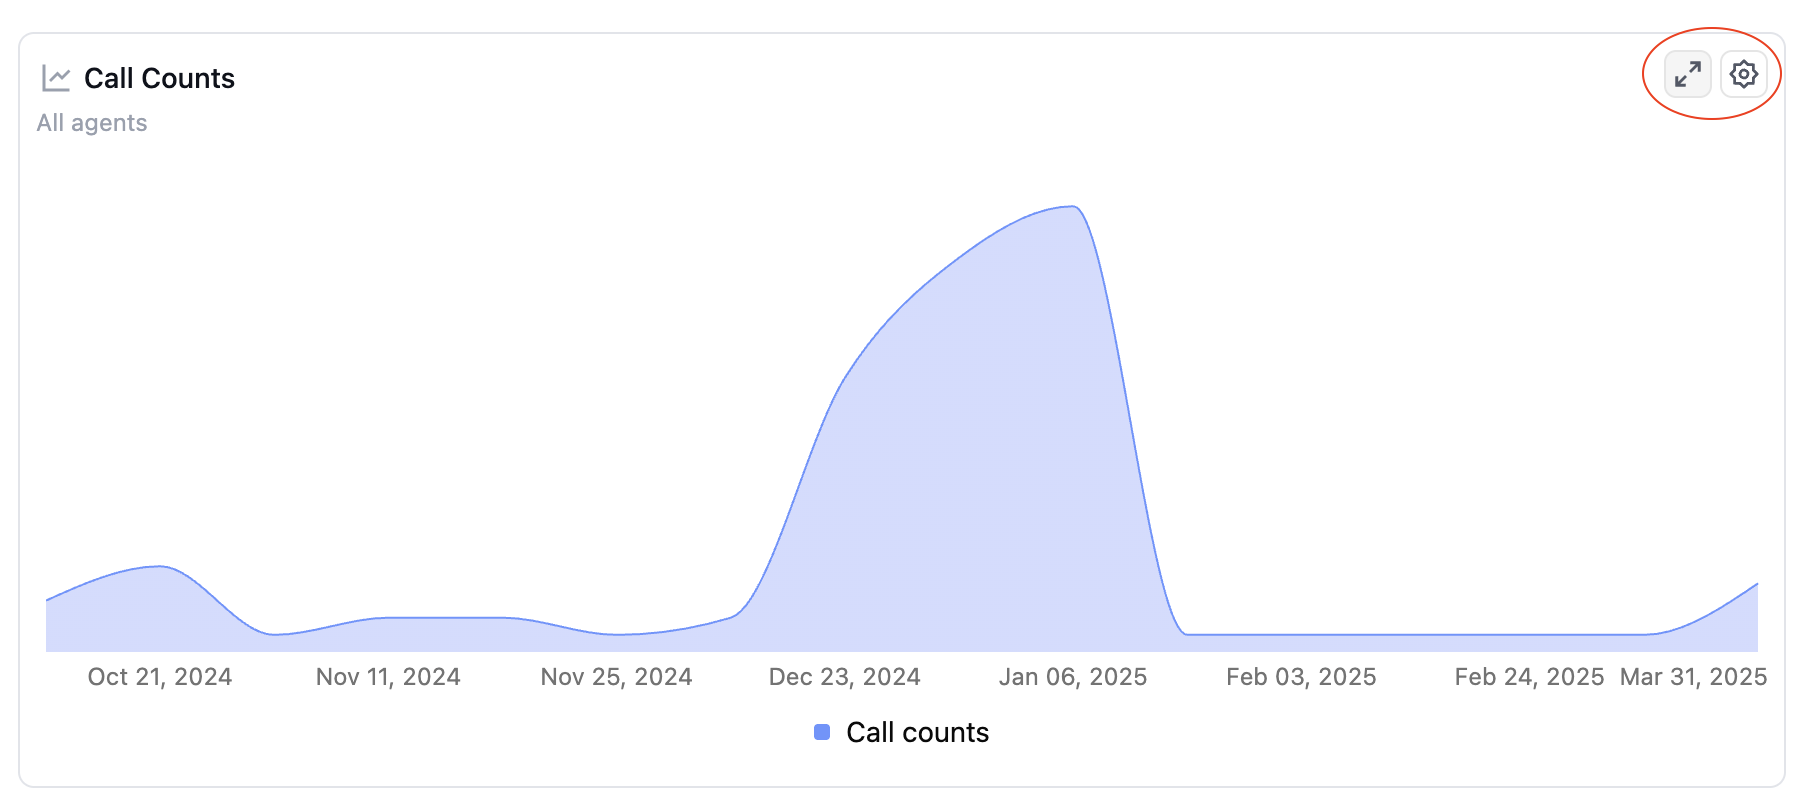
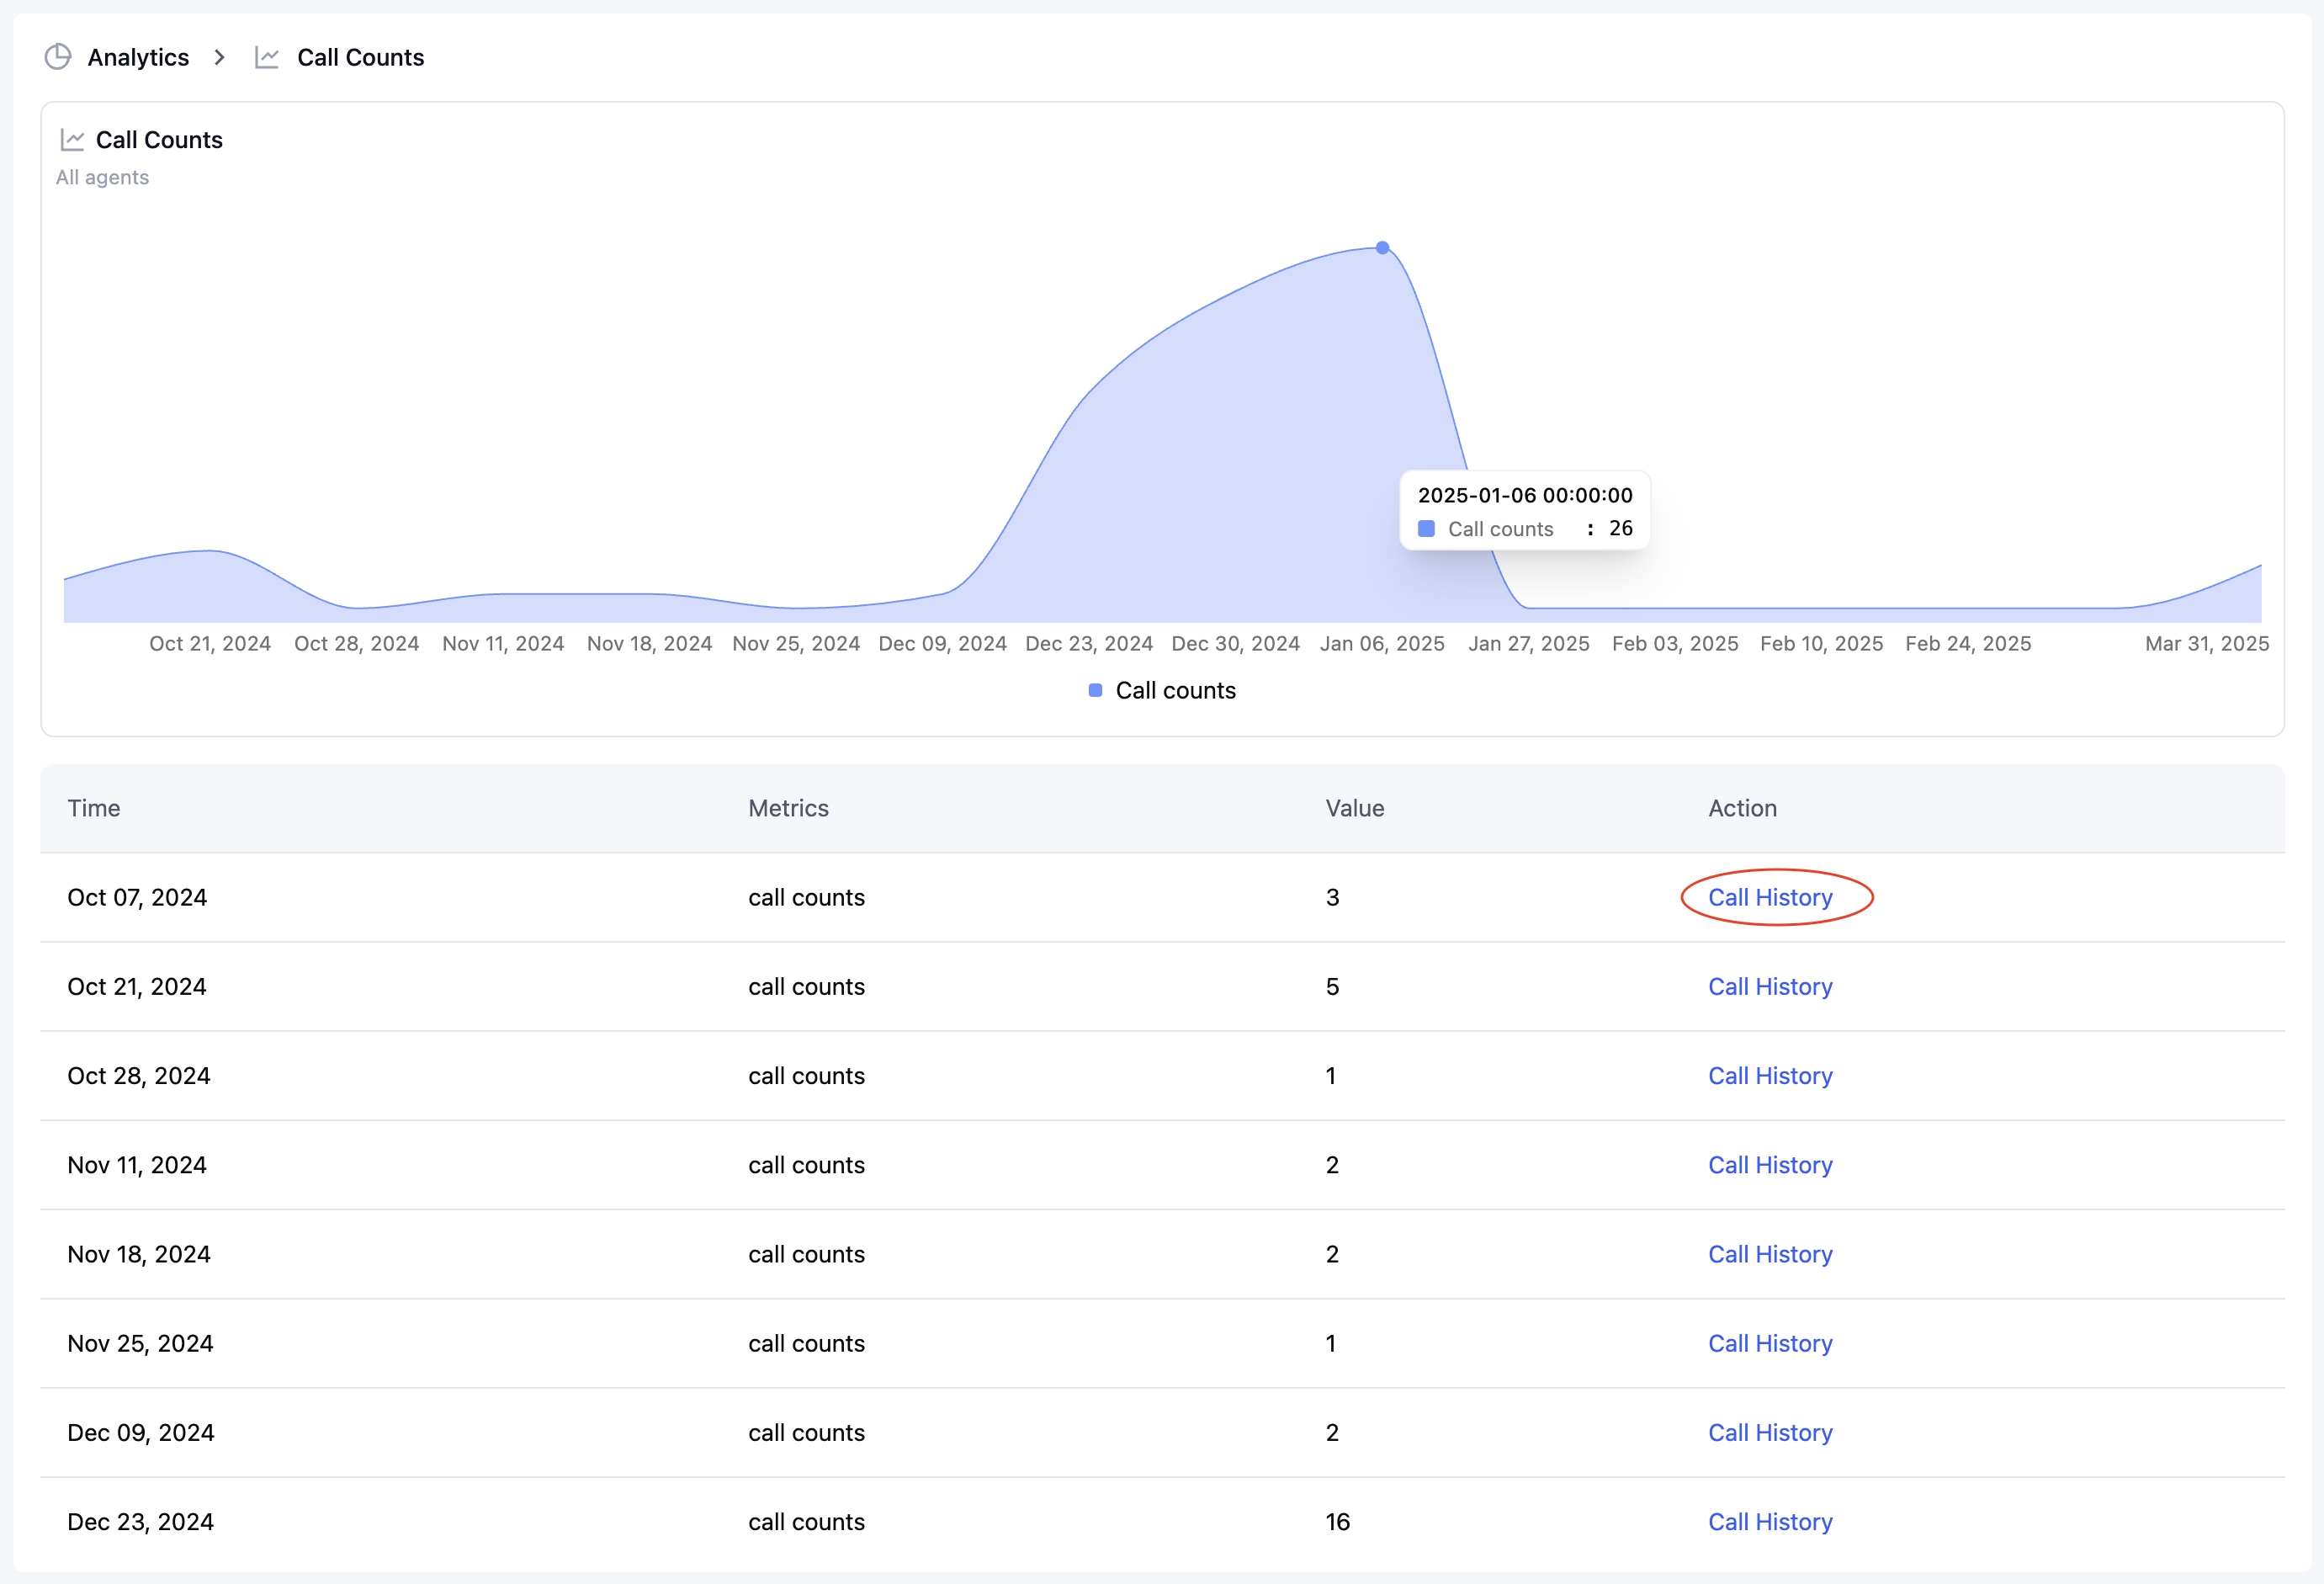 Expand the chart to see data breakdowns, then click into call history to see the related calls.
Up to **10 dashboards** per organization. Each is scoped to either call or chat data.
No — per-chart filters are merged with dashboard filters, so both apply. Use per-chart filters to narrow a specific chart without affecting the rest of the dashboard.
Expand the chart to see data breakdowns, then click into call history to see the related calls.
Up to **10 dashboards** per organization. Each is scoped to either call or chat data.
No — per-chart filters are merged with dashboard filters, so both apply. Use per-chart filters to narrow a specific chart without affecting the rest of the dashboard.