> ## Documentation Index
> Fetch the complete documentation index at: https://docs.retellai.com/llms.txt
> Use this file to discover all available pages before exploring further.
# Check actual latency
> Monitor per-call latency in the Retell Call History dashboard or via the Get Call API — review P50, P90, and P99 end-to-end latency to find slow calls.
You can monitor the latency of individual calls in the "Call History" section.
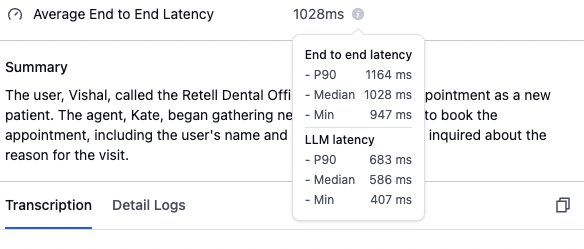 ### Understanding latency metrics
End-to-end latency measures the total time from when the user stops speaking until the AI agent begins responding. This includes processing time, network delays, and model inference time.
### Key metrics explained
* **P90 (90th Percentile)**: 90% of calls have latency below this value.
* **Median (50th Percentile)**: Half of the calls have latency less than this value.
* **Min**: The fastest response time achieved in any call.
## Retrieve latency via the API
You can also retrieve detailed latency breakdowns programmatically using the [Get Call API](/api-references/get-call). After a call ends, the response includes a `latency` object with per-component metrics.
```bash cURL theme={null}
curl -X GET "https://api.retellai.com/v2/get-call/CALL_ID" \
-H "Authorization: Bearer YOUR_API_KEY"
```
```python Python theme={null}
from retell import Retell
client = Retell(api_key="YOUR_API_KEY")
call = client.call.retrieve("CALL_ID")
print(call.latency)
```
```javascript Node.js theme={null}
import Retell from "retell-ai";
const client = new Retell({ apiKey: "YOUR_API_KEY" });
const call = await client.call.retrieve("CALL_ID");
console.log(call.latency);
```
### Latency breakdown fields
The `latency` object contains the following components. Not all fields are present on every call — availability depends on the call type and features used.
| Field | Description |
| --------------------------- | --------------------------------------------------------------------------------------------------------------------------------------------------------------------------- |
| `e2e` | End-to-end latency from when the user stops talking to when the agent starts talking. Does not account for network trip time from the Retell server to the user's frontend. |
| `asr` | Transcription latency — the difference between the duration of audio chunks streamed and the duration of the transcribed portion. |
| `llm` | LLM latency from the start of the LLM call to the first speakable chunk received. When using a custom LLM, this includes the websocket roundtrip time. |
| `llm_websocket_network_rtt` | Websocket roundtrip latency between your server and the Retell server. Only populated for calls using a custom LLM. |
| `tts` | Text-to-speech latency from triggering TTS to the first audio byte received. |
| `knowledge_base` | Knowledge base retrieval latency from triggering retrieval to receiving all relevant context. Only populated when the agent uses the knowledge base feature. |
| `s2s` | Speech-to-speech latency from requesting a response to the first byte received. Only populated for calls using a speech-to-speech model (e.g., Realtime API). |
Each component is an object with these statistical fields:
| Field | Type | Description |
| -------- | --------- | -------------------------------------------------- |
| `p50` | number | 50th percentile (median) latency in milliseconds |
| `p90` | number | 90th percentile latency in milliseconds |
| `p95` | number | 95th percentile latency in milliseconds |
| `p99` | number | 99th percentile latency in milliseconds |
| `min` | number | Minimum latency in milliseconds |
| `max` | number | Maximum latency in milliseconds |
| `num` | number | Number of data points tracked |
| `values` | number\[] | All individual latency data points in milliseconds |
### Example response
Here is an example of the `latency` portion of a Get Call response:
```json theme={null}
{
"latency": {
"e2e": {
"p50": 800,
"p90": 1200,
"p95": 1500,
"p99": 2500,
"min": 500,
"max": 2700,
"num": 10,
"values": [500, 620, 780, 800, 850, 900, 1100, 1200, 1500, 2700]
},
"llm": {
"p50": 400,
"p90": 650,
"p95": 800,
"p99": 1200,
"min": 250,
"max": 1300,
"num": 10,
"values": [250, 310, 380, 400, 420, 500, 600, 650, 800, 1300]
},
"tts": {
"p50": 150,
"p90": 250,
"p95": 300,
"p99": 400,
"min": 80,
"max": 420,
"num": 10,
"values": [80, 100, 130, 150, 160, 200, 230, 250, 300, 420]
}
}
}
```
### Understanding latency metrics
End-to-end latency measures the total time from when the user stops speaking until the AI agent begins responding. This includes processing time, network delays, and model inference time.
### Key metrics explained
* **P90 (90th Percentile)**: 90% of calls have latency below this value.
* **Median (50th Percentile)**: Half of the calls have latency less than this value.
* **Min**: The fastest response time achieved in any call.
## Retrieve latency via the API
You can also retrieve detailed latency breakdowns programmatically using the [Get Call API](/api-references/get-call). After a call ends, the response includes a `latency` object with per-component metrics.
```bash cURL theme={null}
curl -X GET "https://api.retellai.com/v2/get-call/CALL_ID" \
-H "Authorization: Bearer YOUR_API_KEY"
```
```python Python theme={null}
from retell import Retell
client = Retell(api_key="YOUR_API_KEY")
call = client.call.retrieve("CALL_ID")
print(call.latency)
```
```javascript Node.js theme={null}
import Retell from "retell-ai";
const client = new Retell({ apiKey: "YOUR_API_KEY" });
const call = await client.call.retrieve("CALL_ID");
console.log(call.latency);
```
### Latency breakdown fields
The `latency` object contains the following components. Not all fields are present on every call — availability depends on the call type and features used.
| Field | Description |
| --------------------------- | --------------------------------------------------------------------------------------------------------------------------------------------------------------------------- |
| `e2e` | End-to-end latency from when the user stops talking to when the agent starts talking. Does not account for network trip time from the Retell server to the user's frontend. |
| `asr` | Transcription latency — the difference between the duration of audio chunks streamed and the duration of the transcribed portion. |
| `llm` | LLM latency from the start of the LLM call to the first speakable chunk received. When using a custom LLM, this includes the websocket roundtrip time. |
| `llm_websocket_network_rtt` | Websocket roundtrip latency between your server and the Retell server. Only populated for calls using a custom LLM. |
| `tts` | Text-to-speech latency from triggering TTS to the first audio byte received. |
| `knowledge_base` | Knowledge base retrieval latency from triggering retrieval to receiving all relevant context. Only populated when the agent uses the knowledge base feature. |
| `s2s` | Speech-to-speech latency from requesting a response to the first byte received. Only populated for calls using a speech-to-speech model (e.g., Realtime API). |
Each component is an object with these statistical fields:
| Field | Type | Description |
| -------- | --------- | -------------------------------------------------- |
| `p50` | number | 50th percentile (median) latency in milliseconds |
| `p90` | number | 90th percentile latency in milliseconds |
| `p95` | number | 95th percentile latency in milliseconds |
| `p99` | number | 99th percentile latency in milliseconds |
| `min` | number | Minimum latency in milliseconds |
| `max` | number | Maximum latency in milliseconds |
| `num` | number | Number of data points tracked |
| `values` | number\[] | All individual latency data points in milliseconds |
### Example response
Here is an example of the `latency` portion of a Get Call response:
```json theme={null}
{
"latency": {
"e2e": {
"p50": 800,
"p90": 1200,
"p95": 1500,
"p99": 2500,
"min": 500,
"max": 2700,
"num": 10,
"values": [500, 620, 780, 800, 850, 900, 1100, 1200, 1500, 2700]
},
"llm": {
"p50": 400,
"p90": 650,
"p95": 800,
"p99": 1200,
"min": 250,
"max": 1300,
"num": 10,
"values": [250, 310, 380, 400, 420, 500, 600, 650, 800, 1300]
},
"tts": {
"p50": 150,
"p90": 250,
"p95": 300,
"p99": 400,
"min": 80,
"max": 420,
"num": 10,
"values": [80, 100, 130, 150, 160, 200, 230, 250, 300, 420]
}
}
}
```