> ## Documentation Index
> Fetch the complete documentation index at: https://docs.retellai.com/llms.txt
> Use this file to discover all available pages before exploring further.
# Debug SIP calls using PCAP file
> Capture and analyze PCAP files in Wireshark and tshark to diagnose Retell SIP calls — codec negotiation, audio quality, one-way audio, and missed DTMF tones.
PCAP (Packet Capture) files record raw network traffic and are invaluable for diagnosing SIP call issues — including codec negotiation failures, audio quality problems, one-way audio, and missed DTMF tones. This guide walks through capturing and analyzing these files.
## Prerequisites
Install the tools you need:
* **[Wireshark](https://www.wireshark.org/download.html)** — GUI packet analyzer (includes `tshark` CLI)
Verify installation:
```bash theme={null}
wireshark --version
tshark --version
```
***
## Step 1: Open and filter the PCAP in Wireshark
Open the file in Wireshark:
Once Wireshark is installed you can double-click on the PCAP file and your system should open it automatically using the Wireshark application. Alternatively, you can open it by using the following command:
```bash theme={null}
wireshark call_capture.pcap
```
### Filter for SIP traffic only
In the **Display Filter** bar, enter:
```
sip
```
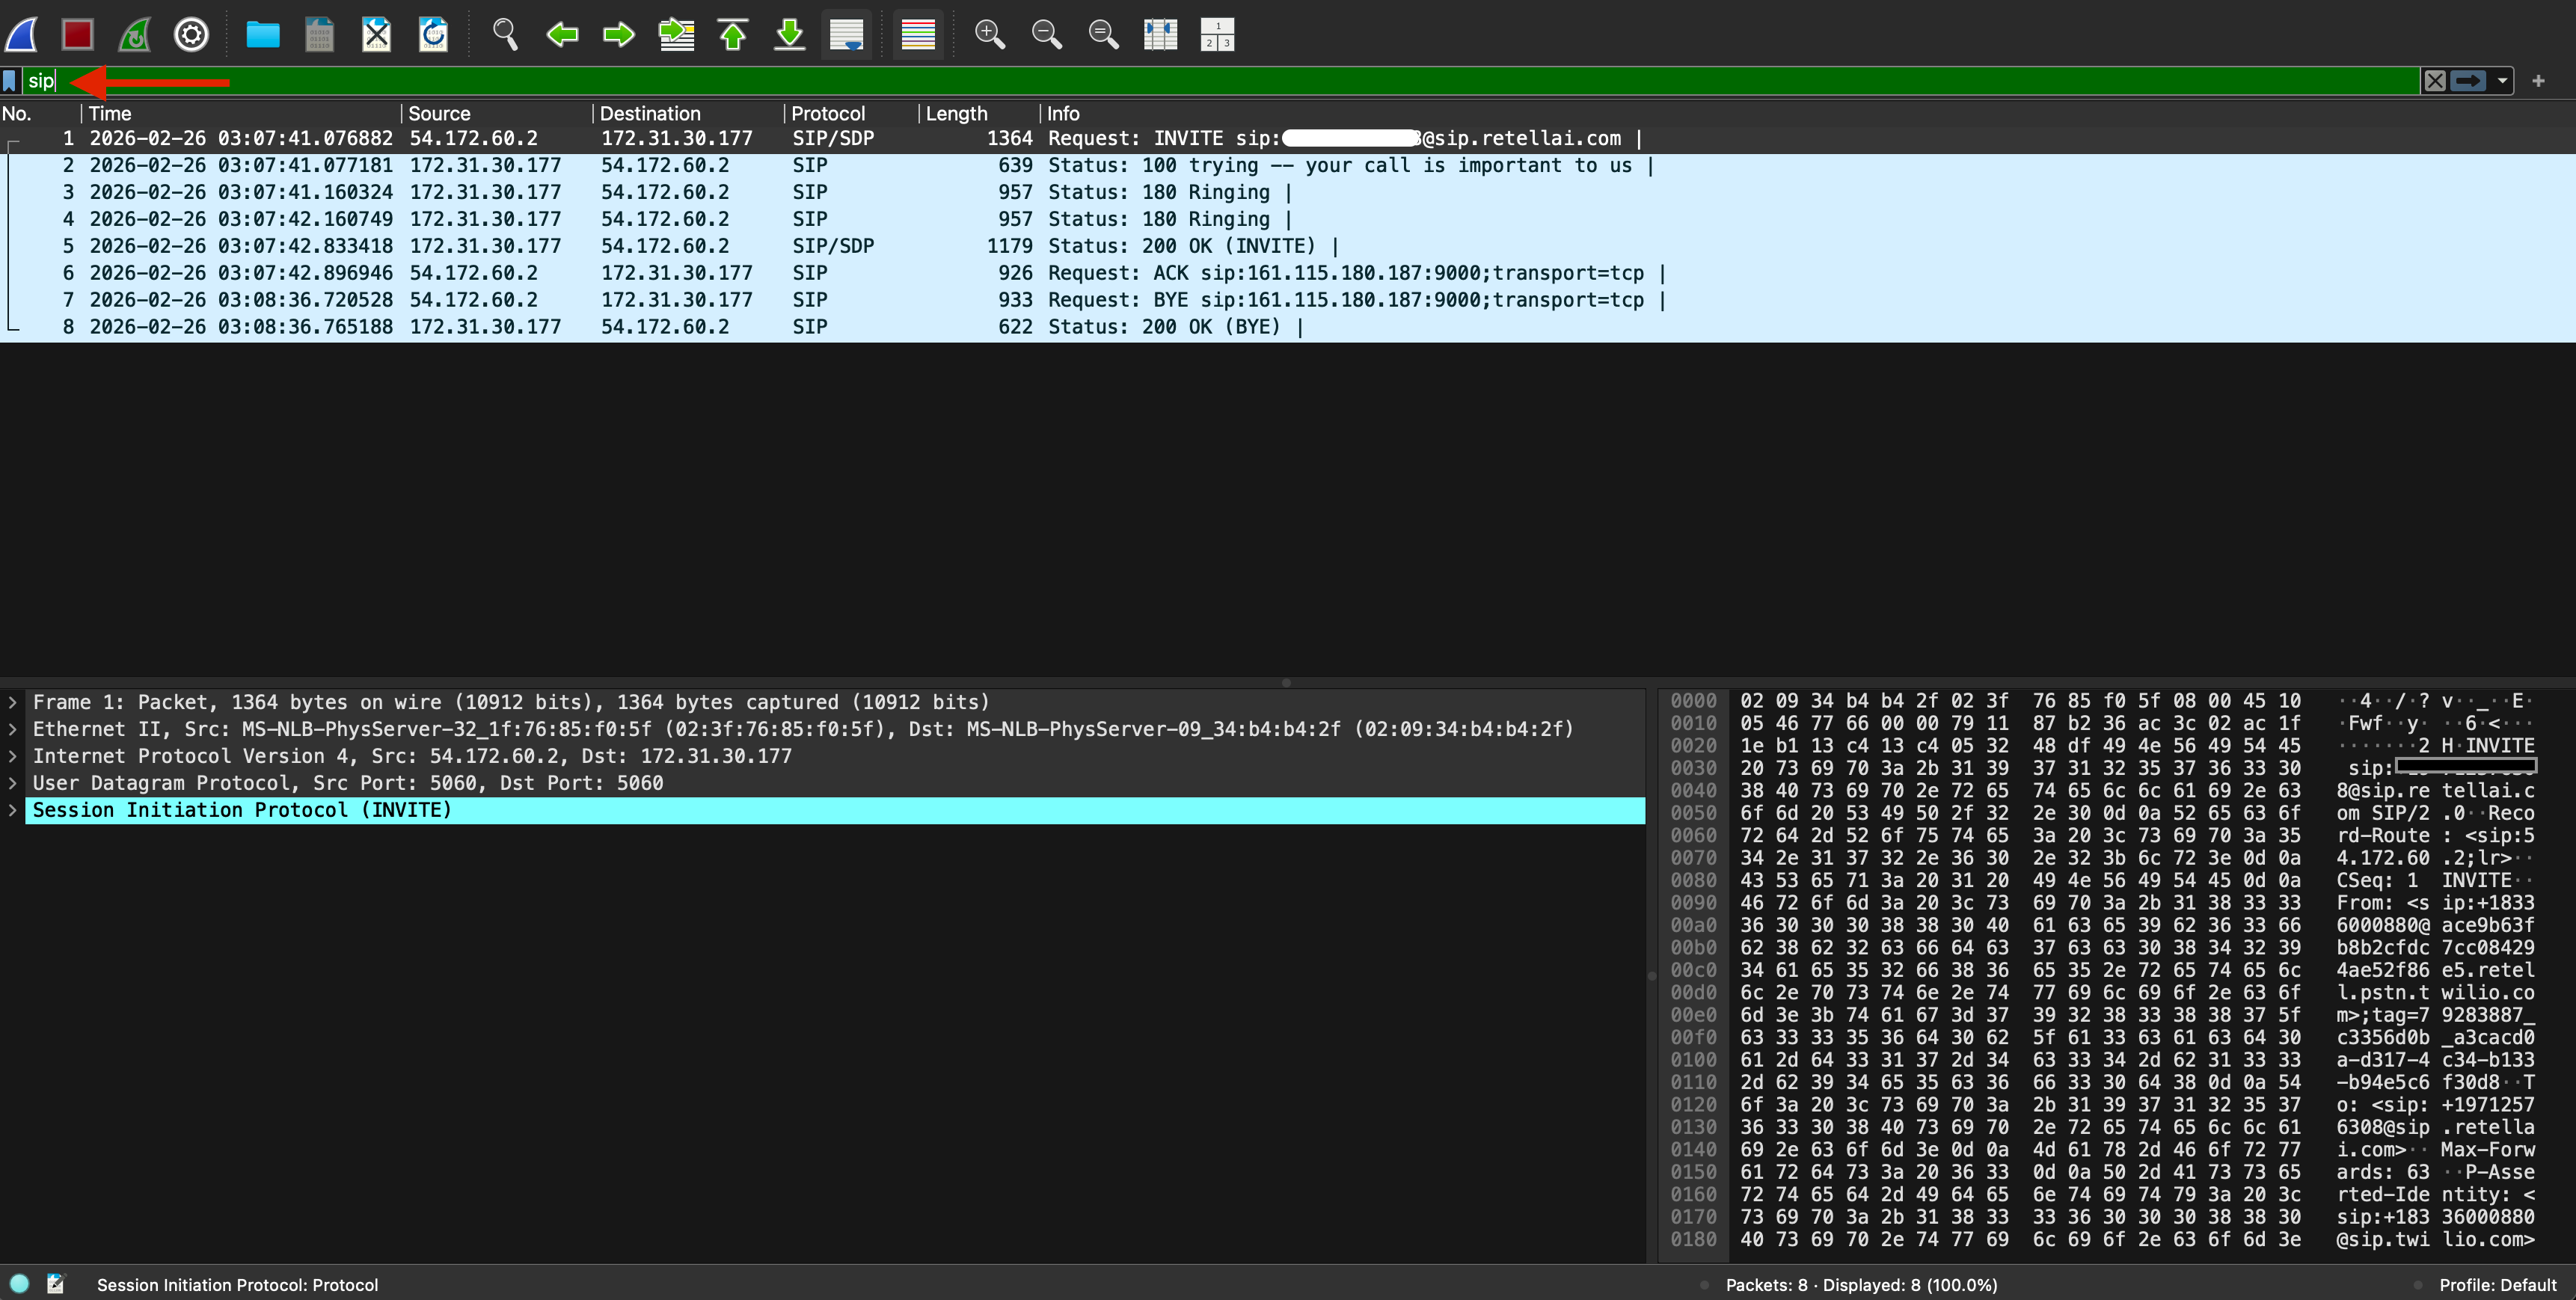 This shows all SIP messages: `INVITE`, `100 Trying`, `180 Ringing`, `200 OK`, `ACK`, `BYE`, `CANCEL`, etc.
### Filter for a specific call (optional)
If you need to isolate a single call, find the `Call-ID` value in any SIP packet, then filter on it:
```
sip.Call-ID == "abc123@192.168.1.1"
```
### Filter for RTP media streams
```
rtp
```
Or combine SIP and RTP:
```
sip or rtp
```
***
## Step 2: Reconstruct the SIP call flow
After filtering SIP call(s), you can view the sequence (ladder) diagram by selecting **Telephony → VoIP Calls**:
This shows all SIP messages: `INVITE`, `100 Trying`, `180 Ringing`, `200 OK`, `ACK`, `BYE`, `CANCEL`, etc.
### Filter for a specific call (optional)
If you need to isolate a single call, find the `Call-ID` value in any SIP packet, then filter on it:
```
sip.Call-ID == "abc123@192.168.1.1"
```
### Filter for RTP media streams
```
rtp
```
Or combine SIP and RTP:
```
sip or rtp
```
***
## Step 2: Reconstruct the SIP call flow
After filtering SIP call(s), you can view the sequence (ladder) diagram by selecting **Telephony → VoIP Calls**:
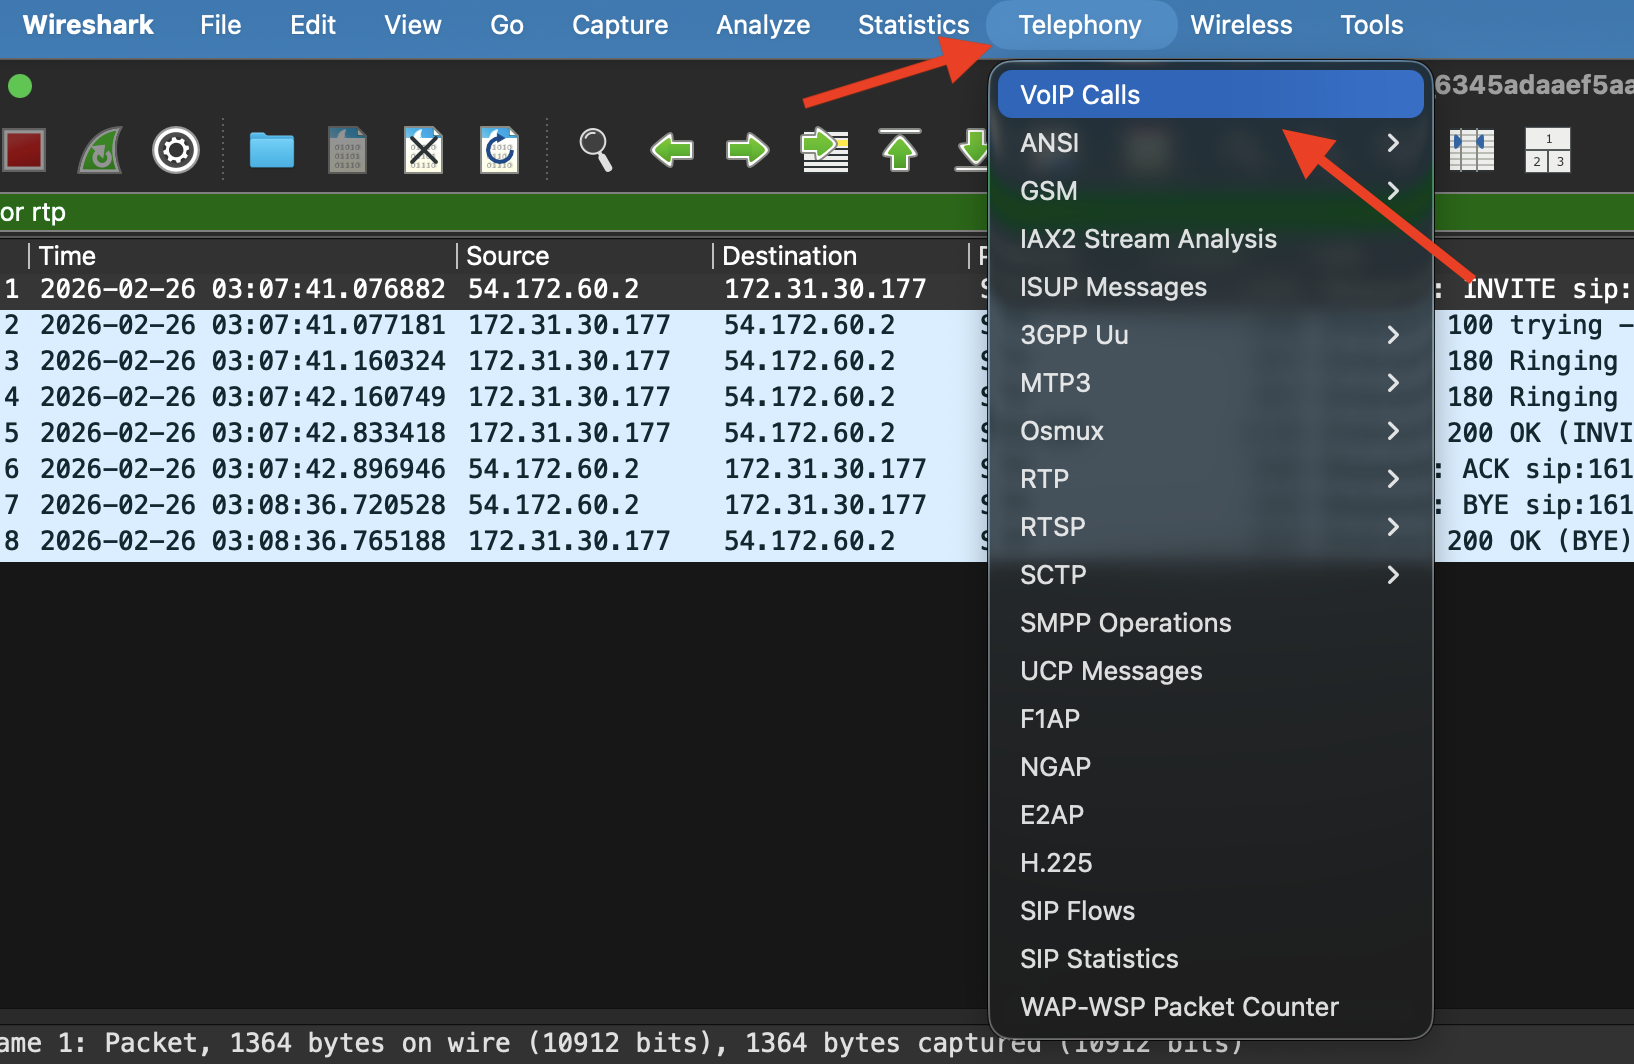 Select the call(s) from the popup window and click **Flow Sequence**:
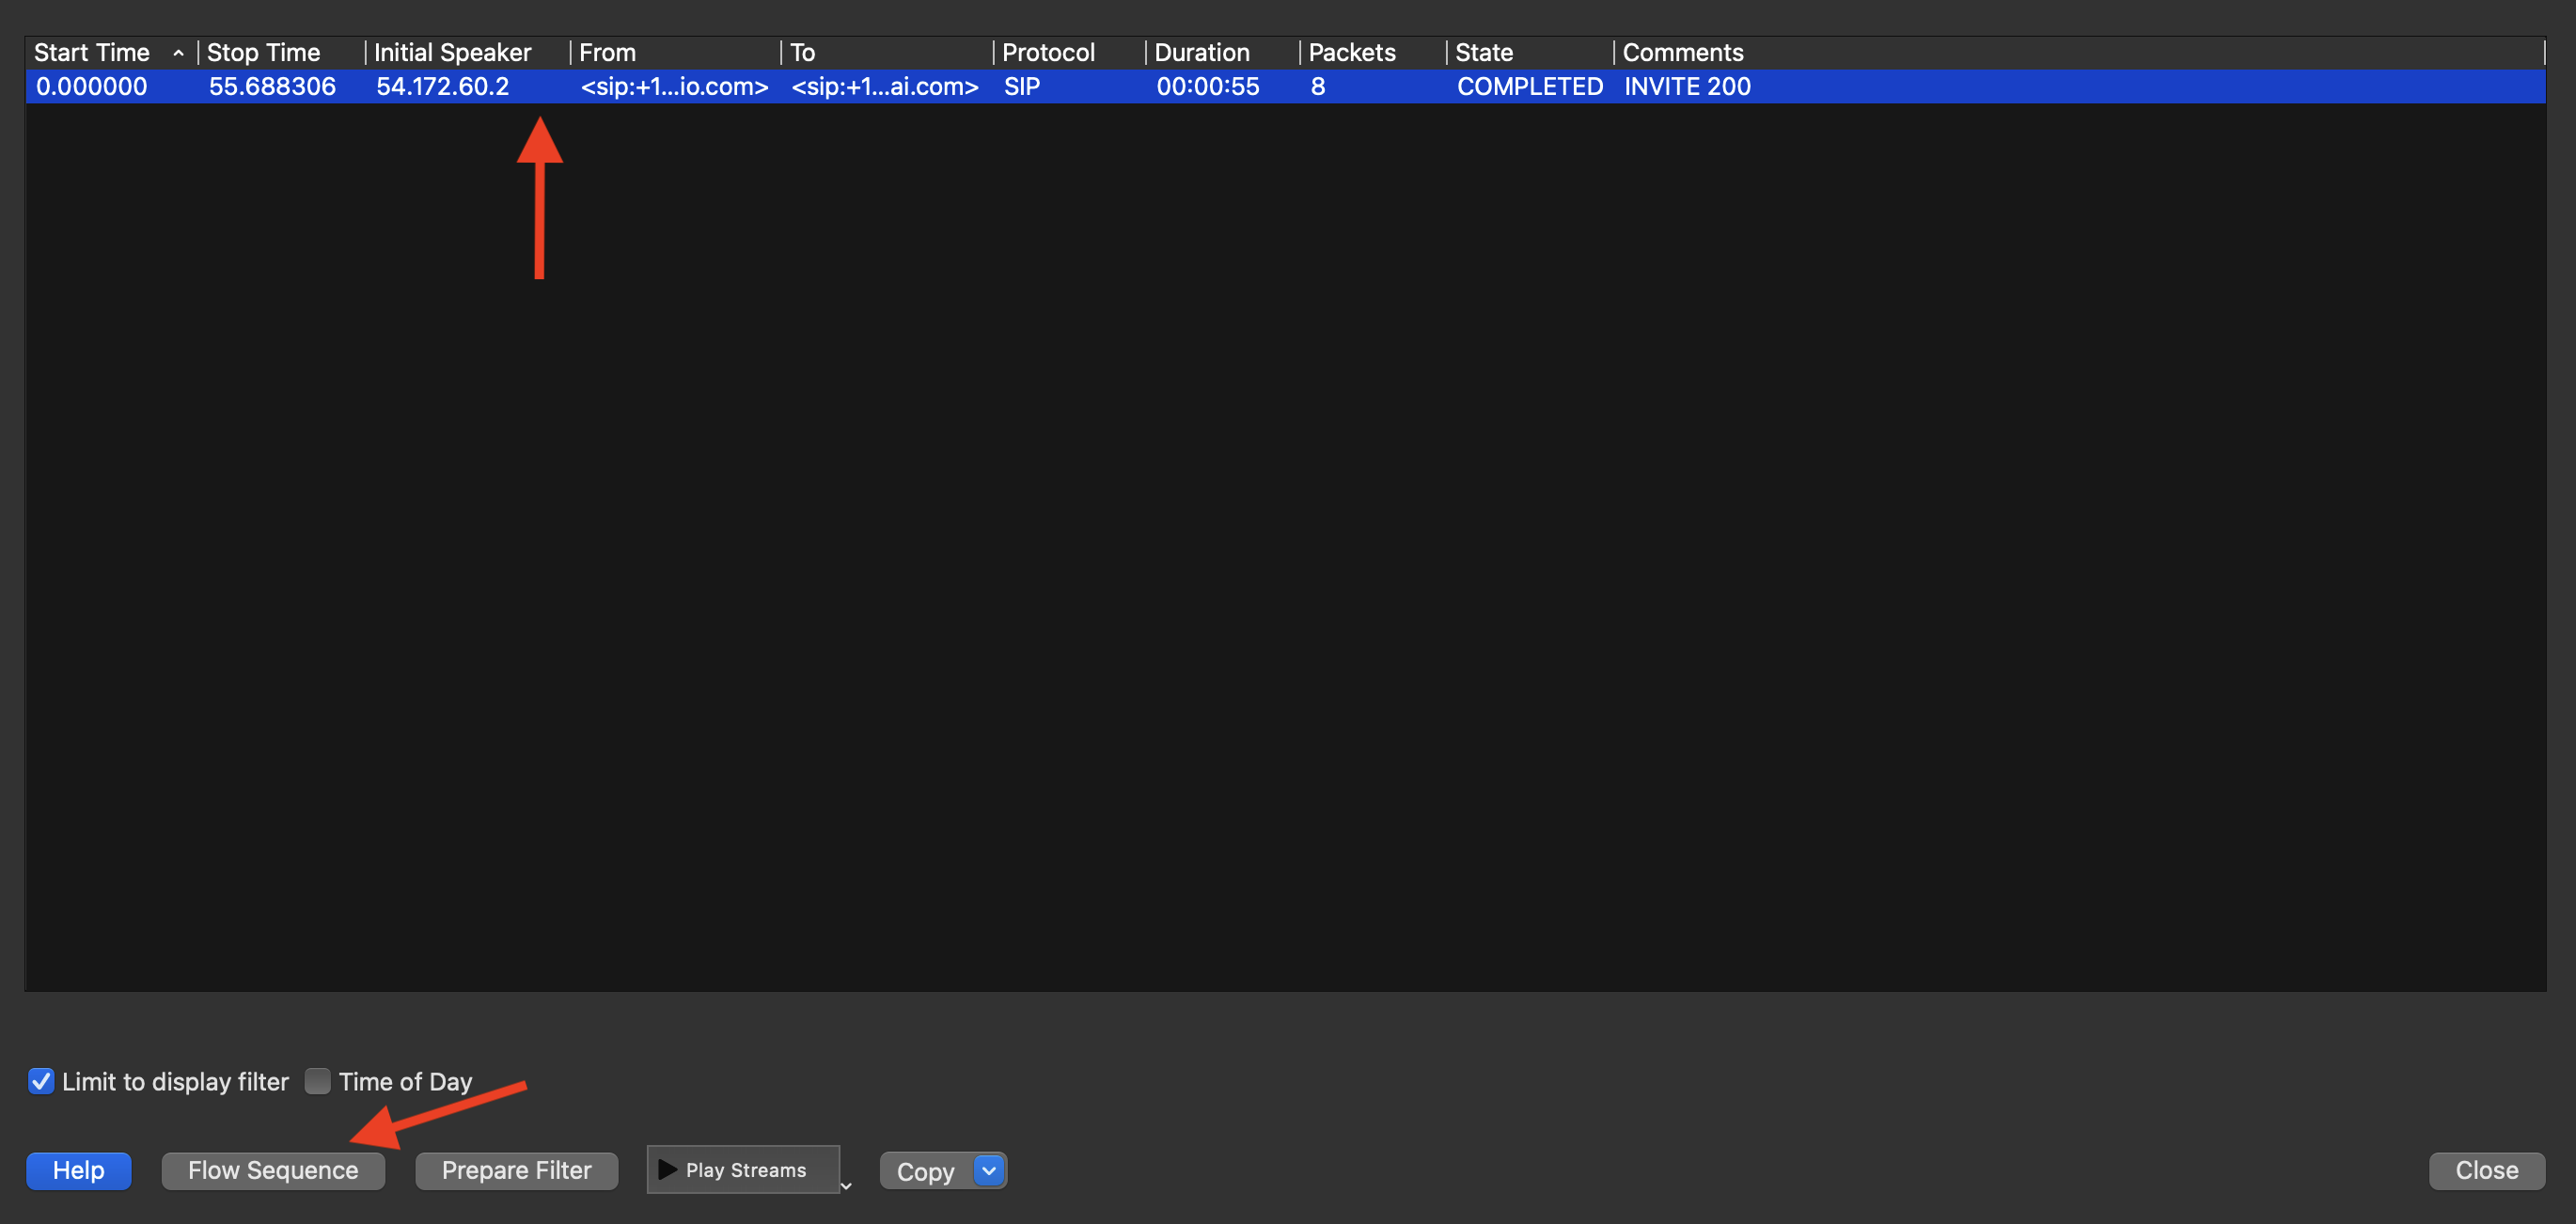 After clicking **Flow Sequence**, a new window opens with the ladder diagram showing the complete message exchange between endpoints:
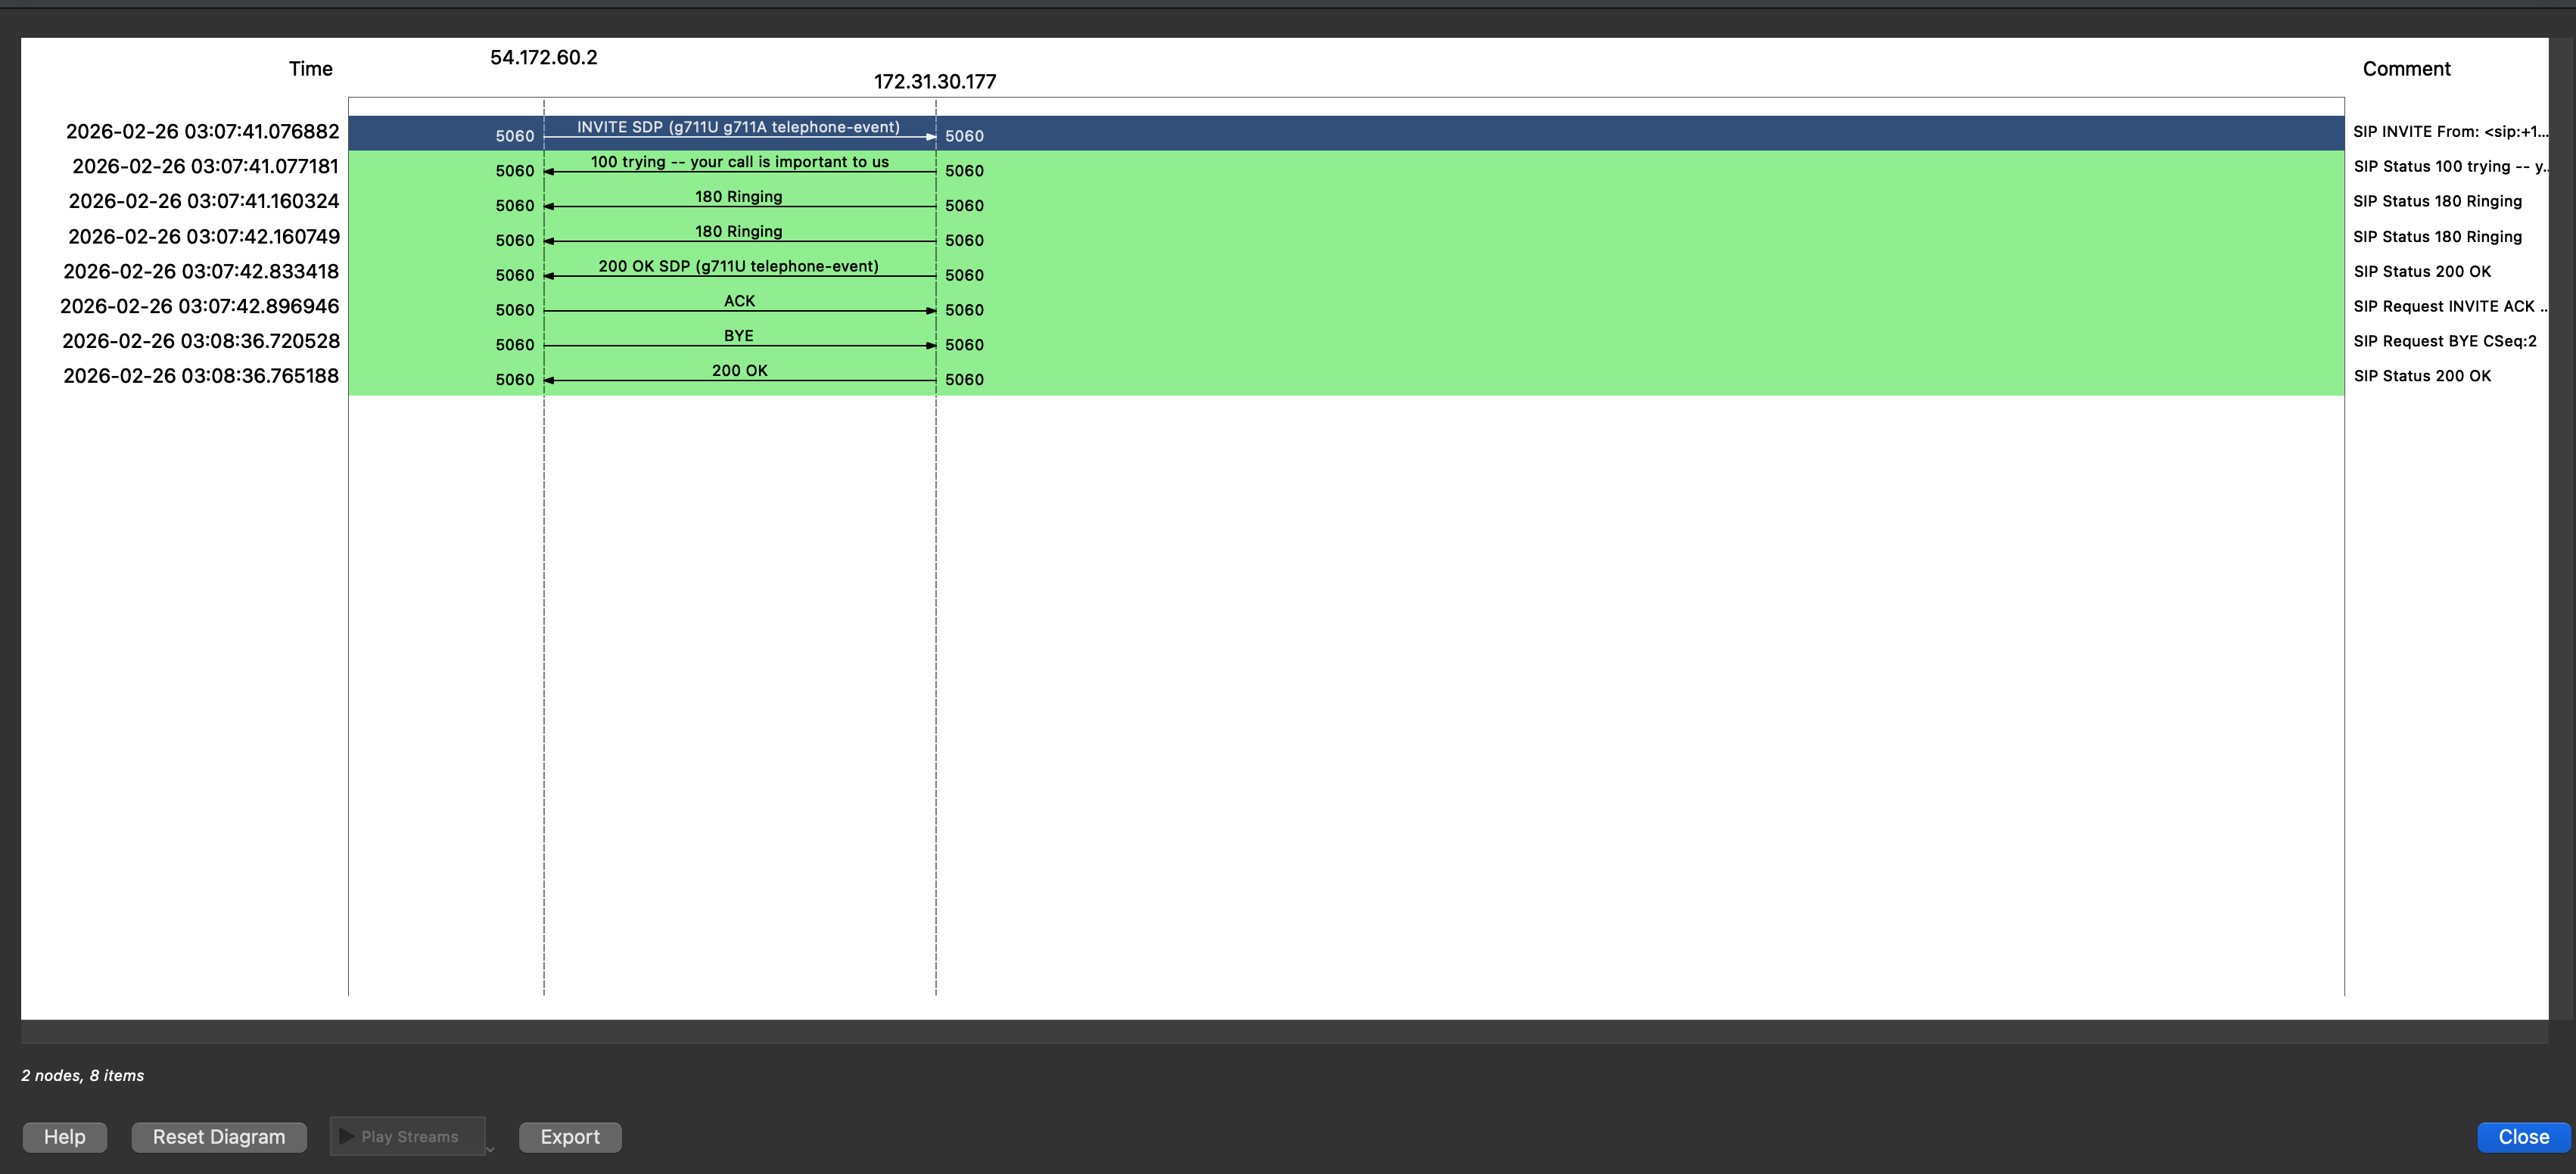 The diagram shows the full call flow — `INVITE` → `100 Trying` → `180 Ringing` → `200 OK` → `ACK` → `BYE`.
### Read a SIP INVITE manually
Click the `INVITE` packet and expand **Session Initiation Protocol** in the packet detail pane. Key fields to inspect:
The diagram shows the full call flow — `INVITE` → `100 Trying` → `180 Ringing` → `200 OK` → `ACK` → `BYE`.
### Read a SIP INVITE manually
Click the `INVITE` packet and expand **Session Initiation Protocol** in the packet detail pane. Key fields to inspect:
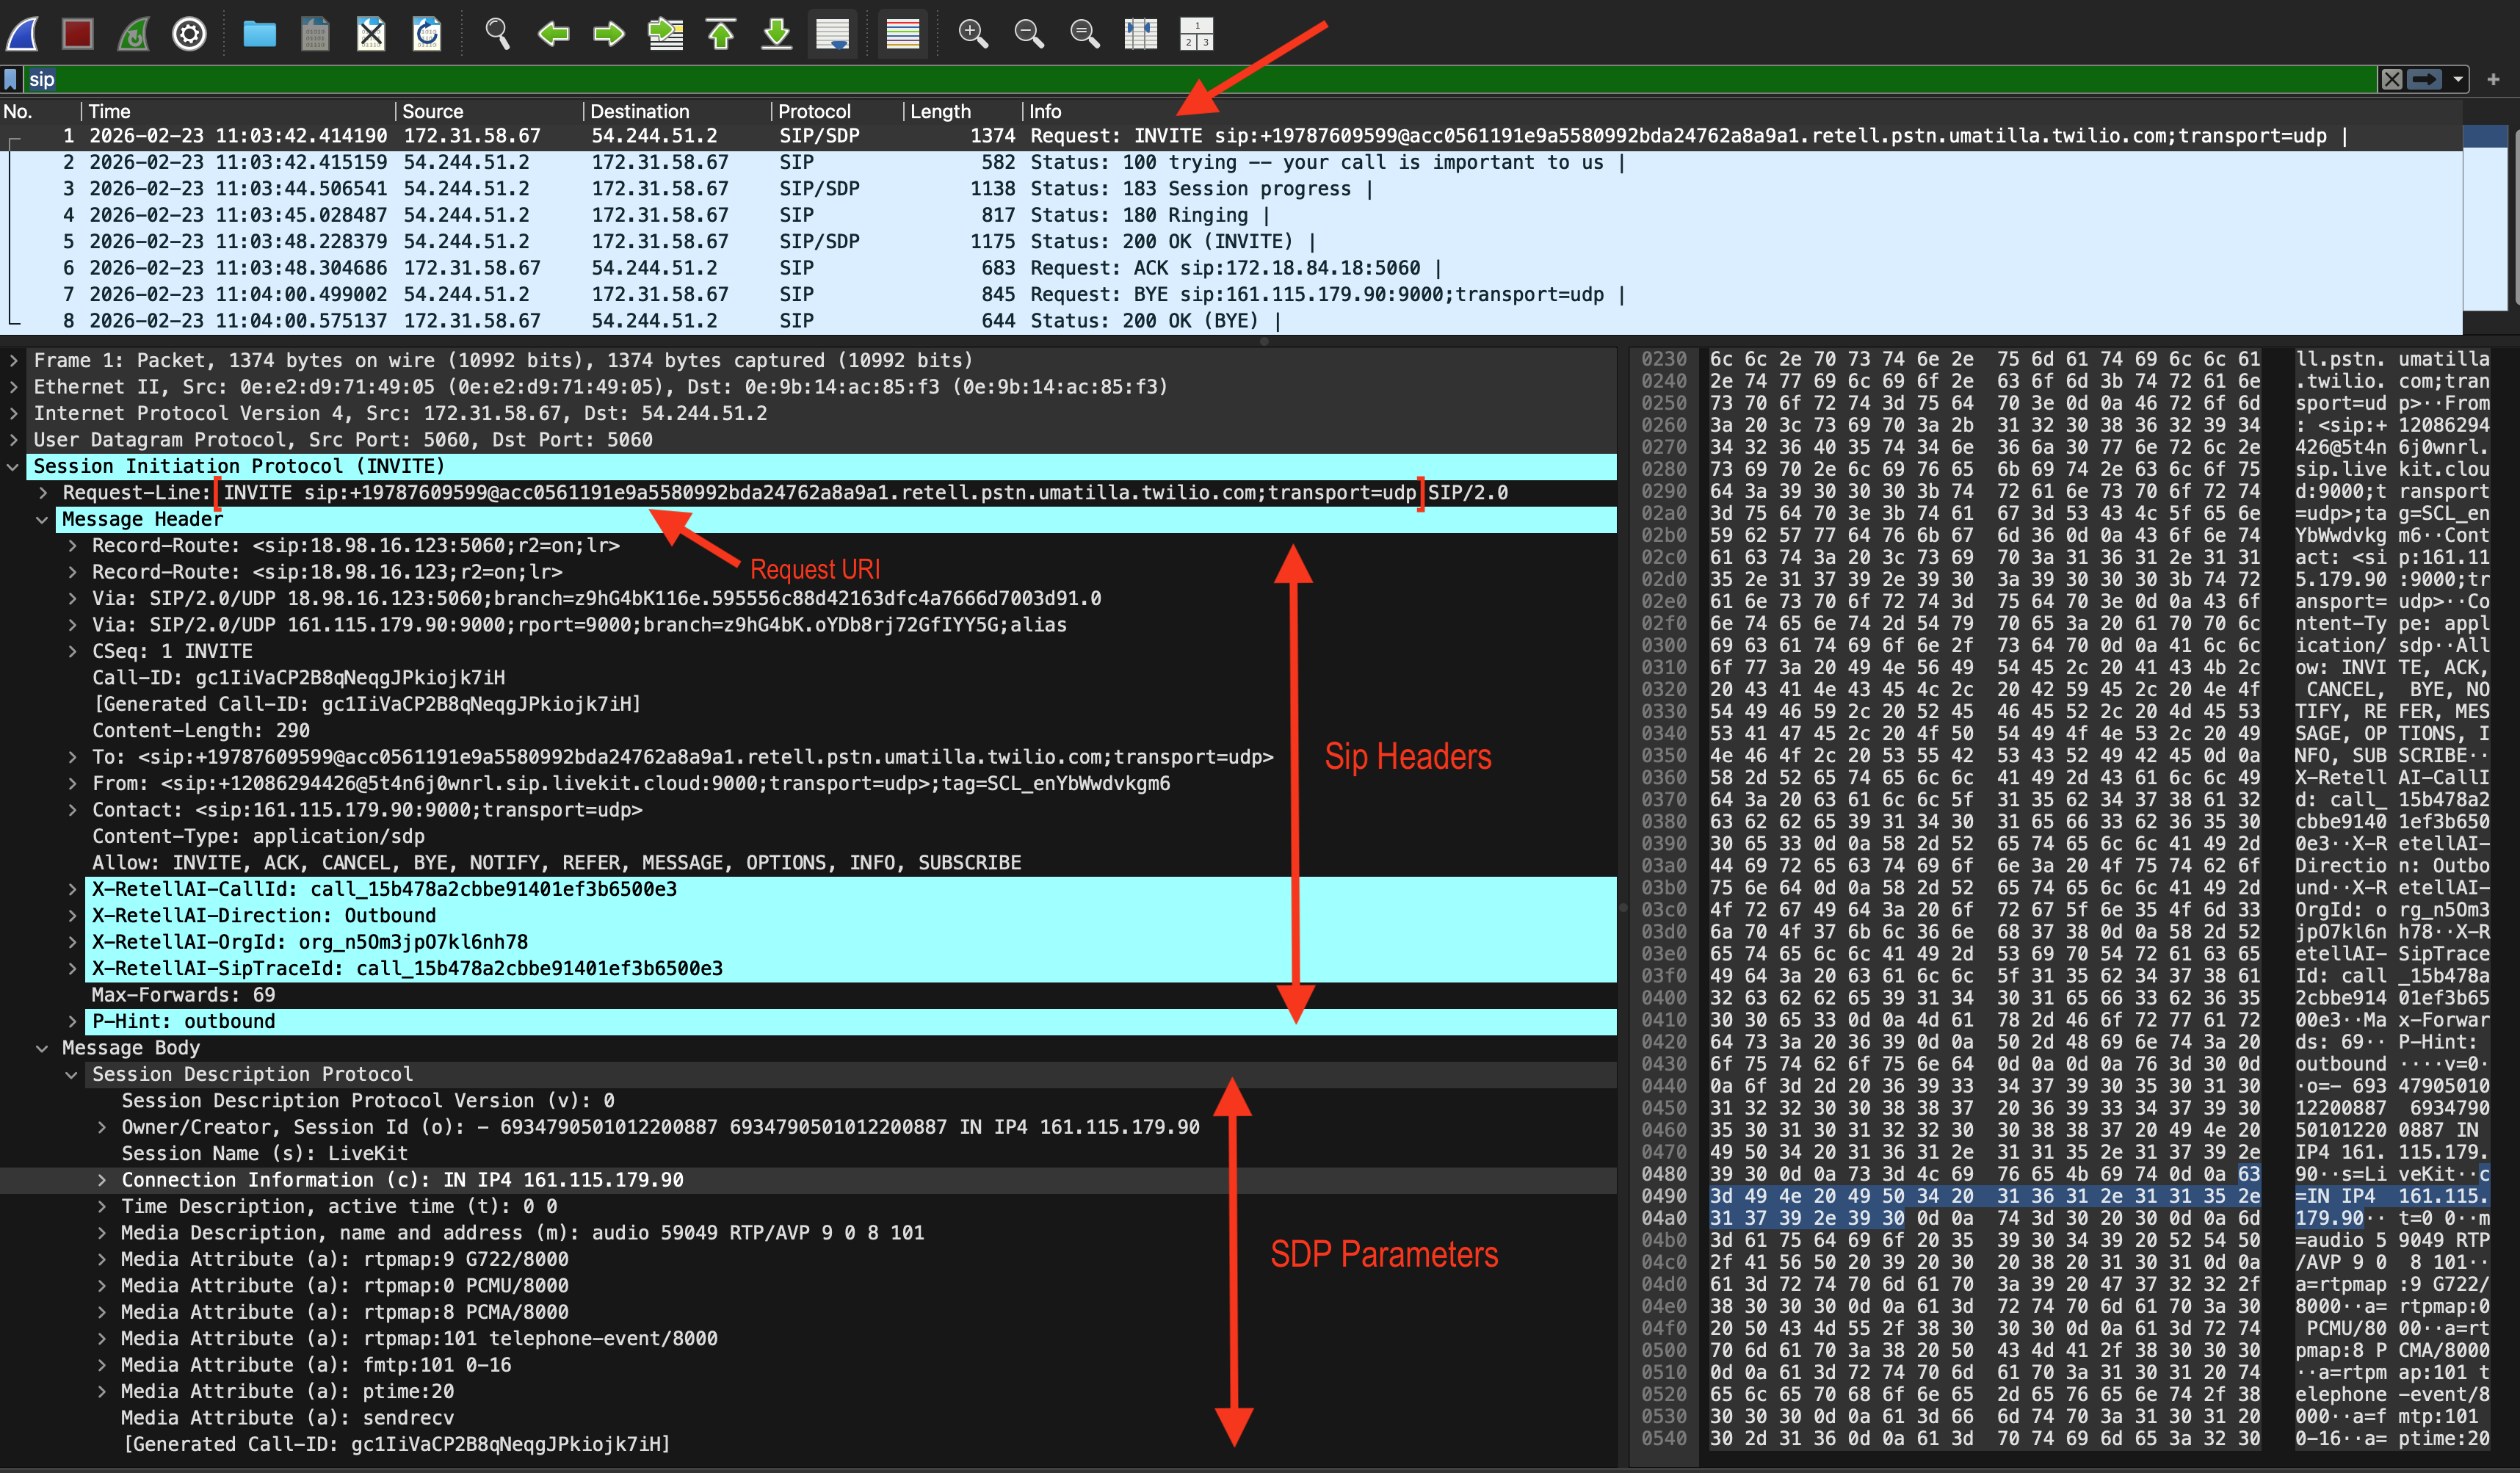 | Field | What to look for |
| ---------------- | ----------------------------------------------------------- |
| `Request-URI` | Destination SIP address |
| `From` / `To` | Caller and callee |
| `Call-ID` | Unique call identifier |
| `SDP → m=audio` | Negotiated RTP port and codec list |
| `SDP → a=rtpmap` | Codec payload type mappings (e.g., PCMU=0, PCMA=8, G.722=9) |
| `SDP → a=fmtp` | Codec parameters |
***
## Step 3: Common issues and what to look for
| Symptom | What to check in PCAP |
| -------------------------------- | ------------------------------------------------------------------------------------------------------------------------------------------------------------------------------------------------------------------------------ |
| One-way audio | RTP flowing only in one direction; check both streams, i.e., check RTP packets for both directions |
| No audio at all | `m=audio` port in SDP is `0` (call on hold), or RTP packets absent (where RTP is supposed to be captured) |
| DTMF not recognized | Payload type mismatch between INVITE SDP and actual RTP packets |
| Audio choppy or robotic | High jitter or packet loss in **RTP Streams** |
| Call drops unexpectedly | Look for `BYE` or `CANCEL`; check SIP response codes (4xx, 5xx) |
| Call hung up mid-conversation | Could be Media Timeout or Callee simply hung up. Look for the party that initiated the `BYE` |
| Codec mismatch | SDP `200 OK` `a=rtpmap` differs from INVITE; or RTP payload type not in SDP |
| SIP auth failure | `401/407 Proxy Authentication Required` or `403 Forbidden` in SIP flow |
| `408/477` response to INVITE | Remote SIP infrastructure may be unreachable — verify reachability, firewall settings, port (typically 5060 or 5061 for TLS), and SIP URI |
| `486` response to INVITE | Callee rejected the call. Call may be retried later |
| `500/503/603` response to INVITE | Check remote SIP infrastructure and downstream call routing status such as when call is routed to a downstream carrier for delivery; if you purchased phone numbers through Retell, contact [Retell support](/general/support) |
### Common SIP response code reference
| Code | Meaning |
| ------------- | -------------------------------------------------------------------------------------------------------- |
| `100` | Trying |
| `180` | Ringing |
| `200` | OK |
| `401` / `407` | Authentication required |
| `403` | Forbidden (Auth failure. Caller does not have permission to dial or transfer to the number/endpoint) |
| `404` | Not found (wrong number or SIP URI) |
| `408` | Request timeout (SIP message over UDP could not be delivered or the corresponding SIP Response was lost) |
| `477` | Send failed (SIP TCP or TLS transport error) |
| `486` | Busy here (Callee rejected the call) |
| `487` | Request terminated (caller did not pick up) |
| `500` | Server internal error |
| `503` | Service unavailable |
| `603` | Decline |
***
## Quick reference: filter cheatsheet
| Goal | Wireshark filter |
| -------------------- | ----------------------------------------- |
| All SIP | `sip` |
| Specific Call-ID | `sip.Call-ID == "id@host"` |
| SIP INVITE only | `sip.Method == "INVITE"` |
| SIP errors (4xx/5xx) | `sip.Status-Code >= 400` |
| All RTP | `rtp` |
| RFC 2833 DTMF | `rtp.p_type == 101` |
| SIP + RTP combined | `sip or rtp` |
| From specific IP | `ip.src == 192.168.1.10 and (sip or rtp)` |
***
## Advanced Debugging
The sections below use additional tools:
* **`tcpdump`** — command-line capture (pre-installed on Linux/macOS; see [tcpdump.org](https://www.tcpdump.org/) for other platforms)
* **`sngrep`** — SIP-specific terminal UI (install instructions in the sngrep section below)
### Analyze RTP streams
This applies only when your PCAP file contains RTP media packets. Some captures include SIP signaling only — for example, the PCAP files available on the [Retell call details dashboard](/features/session-history) — in which case RTP and DTMF analysis are not available.
#### View all RTP streams
Go to **Telephony → RTP → RTP Streams**.
Wireshark lists each detected stream with:
| Column | Description |
| -------------------- | ----------------------------------------------- |
| Source / Destination | IP:port pairs |
| SSRC | Synchronization source ID |
| Payload type | Codec ID (e.g., 0 = PCMU, 8 = PCMA, 111 = Opus) |
| Packets | Total packets in stream |
| Lost | Packet loss count and percentage |
| Max jitter | Maximum inter-packet jitter in ms |
High packet loss (>3%) or jitter (>30ms) typically causes degraded audio quality or choppy speech on Retell calls. See [Call Performance](/reliability/call-performance) for remediation steps.
#### Play back RTP audio
1. Select a stream in **RTP Streams**.
2. Click **Analyze → Play Streams**.
3. Wireshark decodes and plays back the audio. This lets you hear exactly what was sent or received.
#### Save RTP audio to a file
In the RTP player, click **Save payload** to export raw audio. You can then open it in [Audacity](https://www.audacityteam.org/) or convert it with [ffmpeg](https://ffmpeg.org/download.html). Install ffmpeg if needed: `brew install ffmpeg` (macOS) or `sudo apt install ffmpeg` (Debian/Ubuntu).
```bash theme={null}
# Convert raw PCMU (G.711 ulaw, 8kHz, mono) to WAV
ffmpeg -f mulaw -ar 8000 -ac 1 -i rtp_payload.raw output.wav
```
***
### Extract and inspect DTMF events
#### Check for DTMF negotiation in SDP
In the `INVITE` SDP body, look for:
```
a=rtpmap:101 telephone-event/8000
a=fmtp:101 0-15
```
This means RFC 2833 DTMF is negotiated on payload type `101`. If this line is absent, in-band or SIP INFO DTMF may be used instead.
#### RFC 2833 / RFC 4733 DTMF (most common)
DTMF tones sent as RTP events show up as separate RTP packets with the negotiated telephone-event payload type (commonly `101`).
Filter for them in Wireshark:
```
rtp.p_type == 101
```
Click any matching packet and expand **Real-Time Transport Protocol → RFC 2833 RTP Event**:
| Field | Description |
| -------------- | ------------------------------------------------------------------ |
| `Event ID` | Digit pressed: 0–9, `*`=10, `#`=11, A–D=12–15 |
| `End of event` | `True` on the final packet for this digit |
| `Volume` | Signal level in dBm0 |
| `Duration` | Tone duration in RTP timestamp units (divide by clock rate for ms) |
#### SIP INFO DTMF (less common)
Some providers send DTMF as SIP INFO messages instead of RTP. Filter for them:
```
sip.Method == "INFO"
```
Expand the packet and look for a body like:
```
Signal=5
Duration=160
```
#### In-band DTMF (audio tones in RTP)
In-band DTMF is embedded in the audio stream as 350/440 Hz or 697–1633 Hz dual tones and cannot be filtered directly in Wireshark. To detect it:
1. Export the RTP audio as described in **Analyze RTP streams** above.
2. Analyze in Audacity (View → Spectrogram) or use a DTMF decoder library.
Retell captures RFC 2833 DTMF by default. Refer to [Capture DTMF input from user](/build/user-dtmf) for configuring DTMF completion options (digit limit, termination key, timeout).
***
### Capture a PCAP file
If you don't already have a PCAP, capture one at the network level.
#### Option A: Capture with `tcpdump`
`tcpdump` is pre-installed on Linux and macOS. For other platforms, see [tcpdump.org](https://www.tcpdump.org/).
Capture all SIP (port 5060) and RTP (UDP ports 10000–20000) traffic on your network interface:
```bash theme={null}
sudo tcpdump -i eth0 -w call_capture.pcap \
'udp port 5060 or (udp portrange 10000-20000)'
```
| Flag | Description |
| --------------------------- | ---------------------------------------------------------- |
| `-i eth0` | Network interface to capture on (use `any` to capture all) |
| `-w call_capture.pcap` | Output file |
| `udp port 5060` | SIP signaling traffic |
| `udp portrange 10000-20000` | Typical RTP media port range |
Stop the capture with `Ctrl+C` once the call ends.
#### Option B: Capture with Wireshark (GUI)
1. Open Wireshark and select your network interface.
2. Set the capture filter: `udp port 5060 or udp portrange 10000-20000`
3. Click **Start** (blue shark fin icon).
4. Place and complete the test call.
5. Click **Stop**, then **File → Save As** to save as `.pcap` or `.pcapng`.
If you are using Retell with a custom SIP trunk, capture traffic on the server or gateway that terminates SIP — not your local machine. See [Custom Telephony](/deploy/custom-telephony) for Retell's SIP server IP ranges to filter for.
***
### Analyze with `tshark` (CLI)
For scripting and server-side analysis without a GUI:
#### Extract all SIP messages
```bash theme={null}
tshark -r call_capture.pcap -Y sip -T fields \
-e frame.time \
-e ip.src \
-e ip.dst \
-e sip.Method \
-e sip.Status-Code \
-e sip.Call-ID
```
#### List all RTP streams with stats
```bash theme={null}
tshark -r call_capture.pcap -q -z rtp,streams
```
#### Extract RFC 2833 DTMF events
```bash theme={null}
tshark -r call_capture.pcap \
-Y "rtp.p_type == 101" \
-T fields \
-e frame.time \
-e ip.src \
-e rtpevent.event_id \
-e rtpevent.end_of_event
```
#### Export all RTP audio for a stream
```bash theme={null}
tshark -r call_capture.pcap \
--export-objects rtp,/tmp/rtp_streams/
```
***
### Use `sngrep` for a quick terminal SIP view (optional)
`sngrep` provides a real-time or offline SIP ladder diagram in the terminal — no GUI needed.
```bash theme={null}
# Install
brew install sngrep # macOS
sudo apt install sngrep # Debian/Ubuntu
# Read from PCAP
sngrep -I call_capture.pcap
# Live capture on SIP port
sudo sngrep -d eth0 port 5060
```
Navigate with arrow keys to select a call, then press **Enter** to view its full SIP flow and raw message content.
| Field | What to look for |
| ---------------- | ----------------------------------------------------------- |
| `Request-URI` | Destination SIP address |
| `From` / `To` | Caller and callee |
| `Call-ID` | Unique call identifier |
| `SDP → m=audio` | Negotiated RTP port and codec list |
| `SDP → a=rtpmap` | Codec payload type mappings (e.g., PCMU=0, PCMA=8, G.722=9) |
| `SDP → a=fmtp` | Codec parameters |
***
## Step 3: Common issues and what to look for
| Symptom | What to check in PCAP |
| -------------------------------- | ------------------------------------------------------------------------------------------------------------------------------------------------------------------------------------------------------------------------------ |
| One-way audio | RTP flowing only in one direction; check both streams, i.e., check RTP packets for both directions |
| No audio at all | `m=audio` port in SDP is `0` (call on hold), or RTP packets absent (where RTP is supposed to be captured) |
| DTMF not recognized | Payload type mismatch between INVITE SDP and actual RTP packets |
| Audio choppy or robotic | High jitter or packet loss in **RTP Streams** |
| Call drops unexpectedly | Look for `BYE` or `CANCEL`; check SIP response codes (4xx, 5xx) |
| Call hung up mid-conversation | Could be Media Timeout or Callee simply hung up. Look for the party that initiated the `BYE` |
| Codec mismatch | SDP `200 OK` `a=rtpmap` differs from INVITE; or RTP payload type not in SDP |
| SIP auth failure | `401/407 Proxy Authentication Required` or `403 Forbidden` in SIP flow |
| `408/477` response to INVITE | Remote SIP infrastructure may be unreachable — verify reachability, firewall settings, port (typically 5060 or 5061 for TLS), and SIP URI |
| `486` response to INVITE | Callee rejected the call. Call may be retried later |
| `500/503/603` response to INVITE | Check remote SIP infrastructure and downstream call routing status such as when call is routed to a downstream carrier for delivery; if you purchased phone numbers through Retell, contact [Retell support](/general/support) |
### Common SIP response code reference
| Code | Meaning |
| ------------- | -------------------------------------------------------------------------------------------------------- |
| `100` | Trying |
| `180` | Ringing |
| `200` | OK |
| `401` / `407` | Authentication required |
| `403` | Forbidden (Auth failure. Caller does not have permission to dial or transfer to the number/endpoint) |
| `404` | Not found (wrong number or SIP URI) |
| `408` | Request timeout (SIP message over UDP could not be delivered or the corresponding SIP Response was lost) |
| `477` | Send failed (SIP TCP or TLS transport error) |
| `486` | Busy here (Callee rejected the call) |
| `487` | Request terminated (caller did not pick up) |
| `500` | Server internal error |
| `503` | Service unavailable |
| `603` | Decline |
***
## Quick reference: filter cheatsheet
| Goal | Wireshark filter |
| -------------------- | ----------------------------------------- |
| All SIP | `sip` |
| Specific Call-ID | `sip.Call-ID == "id@host"` |
| SIP INVITE only | `sip.Method == "INVITE"` |
| SIP errors (4xx/5xx) | `sip.Status-Code >= 400` |
| All RTP | `rtp` |
| RFC 2833 DTMF | `rtp.p_type == 101` |
| SIP + RTP combined | `sip or rtp` |
| From specific IP | `ip.src == 192.168.1.10 and (sip or rtp)` |
***
## Advanced Debugging
The sections below use additional tools:
* **`tcpdump`** — command-line capture (pre-installed on Linux/macOS; see [tcpdump.org](https://www.tcpdump.org/) for other platforms)
* **`sngrep`** — SIP-specific terminal UI (install instructions in the sngrep section below)
### Analyze RTP streams
This applies only when your PCAP file contains RTP media packets. Some captures include SIP signaling only — for example, the PCAP files available on the [Retell call details dashboard](/features/session-history) — in which case RTP and DTMF analysis are not available.
#### View all RTP streams
Go to **Telephony → RTP → RTP Streams**.
Wireshark lists each detected stream with:
| Column | Description |
| -------------------- | ----------------------------------------------- |
| Source / Destination | IP:port pairs |
| SSRC | Synchronization source ID |
| Payload type | Codec ID (e.g., 0 = PCMU, 8 = PCMA, 111 = Opus) |
| Packets | Total packets in stream |
| Lost | Packet loss count and percentage |
| Max jitter | Maximum inter-packet jitter in ms |
High packet loss (>3%) or jitter (>30ms) typically causes degraded audio quality or choppy speech on Retell calls. See [Call Performance](/reliability/call-performance) for remediation steps.
#### Play back RTP audio
1. Select a stream in **RTP Streams**.
2. Click **Analyze → Play Streams**.
3. Wireshark decodes and plays back the audio. This lets you hear exactly what was sent or received.
#### Save RTP audio to a file
In the RTP player, click **Save payload** to export raw audio. You can then open it in [Audacity](https://www.audacityteam.org/) or convert it with [ffmpeg](https://ffmpeg.org/download.html). Install ffmpeg if needed: `brew install ffmpeg` (macOS) or `sudo apt install ffmpeg` (Debian/Ubuntu).
```bash theme={null}
# Convert raw PCMU (G.711 ulaw, 8kHz, mono) to WAV
ffmpeg -f mulaw -ar 8000 -ac 1 -i rtp_payload.raw output.wav
```
***
### Extract and inspect DTMF events
#### Check for DTMF negotiation in SDP
In the `INVITE` SDP body, look for:
```
a=rtpmap:101 telephone-event/8000
a=fmtp:101 0-15
```
This means RFC 2833 DTMF is negotiated on payload type `101`. If this line is absent, in-band or SIP INFO DTMF may be used instead.
#### RFC 2833 / RFC 4733 DTMF (most common)
DTMF tones sent as RTP events show up as separate RTP packets with the negotiated telephone-event payload type (commonly `101`).
Filter for them in Wireshark:
```
rtp.p_type == 101
```
Click any matching packet and expand **Real-Time Transport Protocol → RFC 2833 RTP Event**:
| Field | Description |
| -------------- | ------------------------------------------------------------------ |
| `Event ID` | Digit pressed: 0–9, `*`=10, `#`=11, A–D=12–15 |
| `End of event` | `True` on the final packet for this digit |
| `Volume` | Signal level in dBm0 |
| `Duration` | Tone duration in RTP timestamp units (divide by clock rate for ms) |
#### SIP INFO DTMF (less common)
Some providers send DTMF as SIP INFO messages instead of RTP. Filter for them:
```
sip.Method == "INFO"
```
Expand the packet and look for a body like:
```
Signal=5
Duration=160
```
#### In-band DTMF (audio tones in RTP)
In-band DTMF is embedded in the audio stream as 350/440 Hz or 697–1633 Hz dual tones and cannot be filtered directly in Wireshark. To detect it:
1. Export the RTP audio as described in **Analyze RTP streams** above.
2. Analyze in Audacity (View → Spectrogram) or use a DTMF decoder library.
Retell captures RFC 2833 DTMF by default. Refer to [Capture DTMF input from user](/build/user-dtmf) for configuring DTMF completion options (digit limit, termination key, timeout).
***
### Capture a PCAP file
If you don't already have a PCAP, capture one at the network level.
#### Option A: Capture with `tcpdump`
`tcpdump` is pre-installed on Linux and macOS. For other platforms, see [tcpdump.org](https://www.tcpdump.org/).
Capture all SIP (port 5060) and RTP (UDP ports 10000–20000) traffic on your network interface:
```bash theme={null}
sudo tcpdump -i eth0 -w call_capture.pcap \
'udp port 5060 or (udp portrange 10000-20000)'
```
| Flag | Description |
| --------------------------- | ---------------------------------------------------------- |
| `-i eth0` | Network interface to capture on (use `any` to capture all) |
| `-w call_capture.pcap` | Output file |
| `udp port 5060` | SIP signaling traffic |
| `udp portrange 10000-20000` | Typical RTP media port range |
Stop the capture with `Ctrl+C` once the call ends.
#### Option B: Capture with Wireshark (GUI)
1. Open Wireshark and select your network interface.
2. Set the capture filter: `udp port 5060 or udp portrange 10000-20000`
3. Click **Start** (blue shark fin icon).
4. Place and complete the test call.
5. Click **Stop**, then **File → Save As** to save as `.pcap` or `.pcapng`.
If you are using Retell with a custom SIP trunk, capture traffic on the server or gateway that terminates SIP — not your local machine. See [Custom Telephony](/deploy/custom-telephony) for Retell's SIP server IP ranges to filter for.
***
### Analyze with `tshark` (CLI)
For scripting and server-side analysis without a GUI:
#### Extract all SIP messages
```bash theme={null}
tshark -r call_capture.pcap -Y sip -T fields \
-e frame.time \
-e ip.src \
-e ip.dst \
-e sip.Method \
-e sip.Status-Code \
-e sip.Call-ID
```
#### List all RTP streams with stats
```bash theme={null}
tshark -r call_capture.pcap -q -z rtp,streams
```
#### Extract RFC 2833 DTMF events
```bash theme={null}
tshark -r call_capture.pcap \
-Y "rtp.p_type == 101" \
-T fields \
-e frame.time \
-e ip.src \
-e rtpevent.event_id \
-e rtpevent.end_of_event
```
#### Export all RTP audio for a stream
```bash theme={null}
tshark -r call_capture.pcap \
--export-objects rtp,/tmp/rtp_streams/
```
***
### Use `sngrep` for a quick terminal SIP view (optional)
`sngrep` provides a real-time or offline SIP ladder diagram in the terminal — no GUI needed.
```bash theme={null}
# Install
brew install sngrep # macOS
sudo apt install sngrep # Debian/Ubuntu
# Read from PCAP
sngrep -I call_capture.pcap
# Live capture on SIP port
sudo sngrep -d eth0 port 5060
```
Navigate with arrow keys to select a call, then press **Enter** to view its full SIP flow and raw message content.