You can monitor the latency of individual calls in the “Call History” section.
Call History

Understanding latency metrics

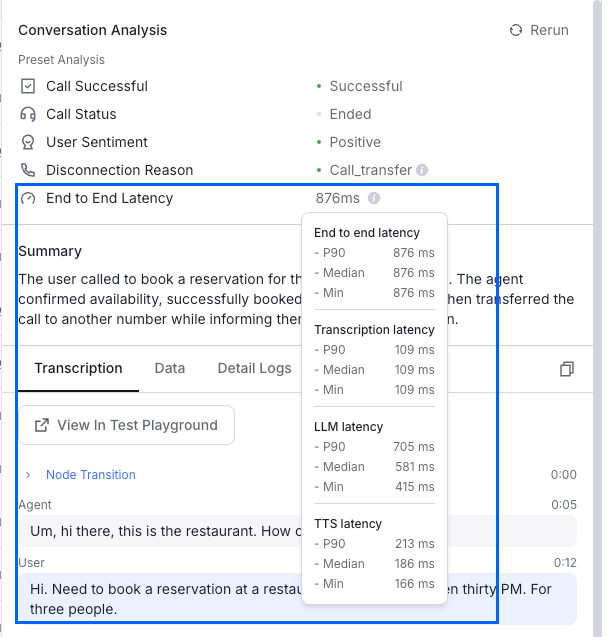
End-to-end latency measures the total time from when the user stops speaking until the AI agent begins responding. This includes processing time, network delays, and model inference time.

Key metrics explained

  • P90 (90th Percentile): 90% of calls have latency below this value.
  • Median (50th Percentile): Half of the calls have latency less than this value.
  • Min: The fastest response time achieved in any call.

Retrieve latency via the API

You can also retrieve detailed latency breakdowns programmatically using the Get Call API. After a call ends, the response includes a latency object with per-component metrics.
curl -X GET "https://api.retellai.com/v2/get-call/CALL_ID" \
  -H "Authorization: Bearer YOUR_API_KEY"

Latency breakdown fields

The latency object contains the following components. Not all fields are present on every call — availability depends on the call type and features used.
FieldDescription
e2eEnd-to-end latency from when the user stops talking to when the agent starts talking. Does not account for network trip time from the Retell server to the user’s frontend.
asrTranscription latency — the difference between the duration of audio chunks streamed and the duration of the transcribed portion.
llmLLM latency from the start of the LLM call to the first speakable chunk received. When using a custom LLM, this includes the websocket roundtrip time.
llm_websocket_network_rttWebsocket roundtrip latency between your server and the Retell server. Only populated for calls using a custom LLM.
ttsText-to-speech latency from triggering TTS to the first audio byte received.
knowledge_baseKnowledge base retrieval latency from triggering retrieval to receiving all relevant context. Only populated when the agent uses the knowledge base feature.
s2sSpeech-to-speech latency from requesting a response to the first byte received. Only populated for calls using a speech-to-speech model (e.g., Realtime API).
Each component is an object with these statistical fields:
FieldTypeDescription
p50number50th percentile (median) latency in milliseconds
p90number90th percentile latency in milliseconds
p95number95th percentile latency in milliseconds
p99number99th percentile latency in milliseconds
minnumberMinimum latency in milliseconds
maxnumberMaximum latency in milliseconds
numnumberNumber of data points tracked
valuesnumber[]All individual latency data points in milliseconds

Example response

Here is an example of the latency portion of a Get Call response:
{
  "latency": {
    "e2e": {
      "p50": 800,
      "p90": 1200,
      "p95": 1500,
      "p99": 2500,
      "min": 500,
      "max": 2700,
      "num": 10,
      "values": [500, 620, 780, 800, 850, 900, 1100, 1200, 1500, 2700]
    },
    "llm": {
      "p50": 400,
      "p90": 650,
      "p95": 800,
      "p99": 1200,
      "min": 250,
      "max": 1300,
      "num": 10,
      "values": [250, 310, 380, 400, 420, 500, 600, 650, 800, 1300]
    },
    "tts": {
      "p50": 150,
      "p90": 250,
      "p95": 300,
      "p99": 400,
      "min": 80,
      "max": 420,
      "num": 10,
      "values": [80, 100, 130, 150, 160, 200, 230, 250, 300, 420]
    }
  }
}