

not_connected outbound calls, see debug outbound connection issues.
Prerequisites
Install the tools you need:- Wireshark — GUI packet analyzer (includes
tsharkCLI)
Step 1: Open and filter the PCAP in Wireshark
Double-click the PCAP file to open it in Wireshark, or run:Filter for SIP traffic only
In the Display Filter bar, enter: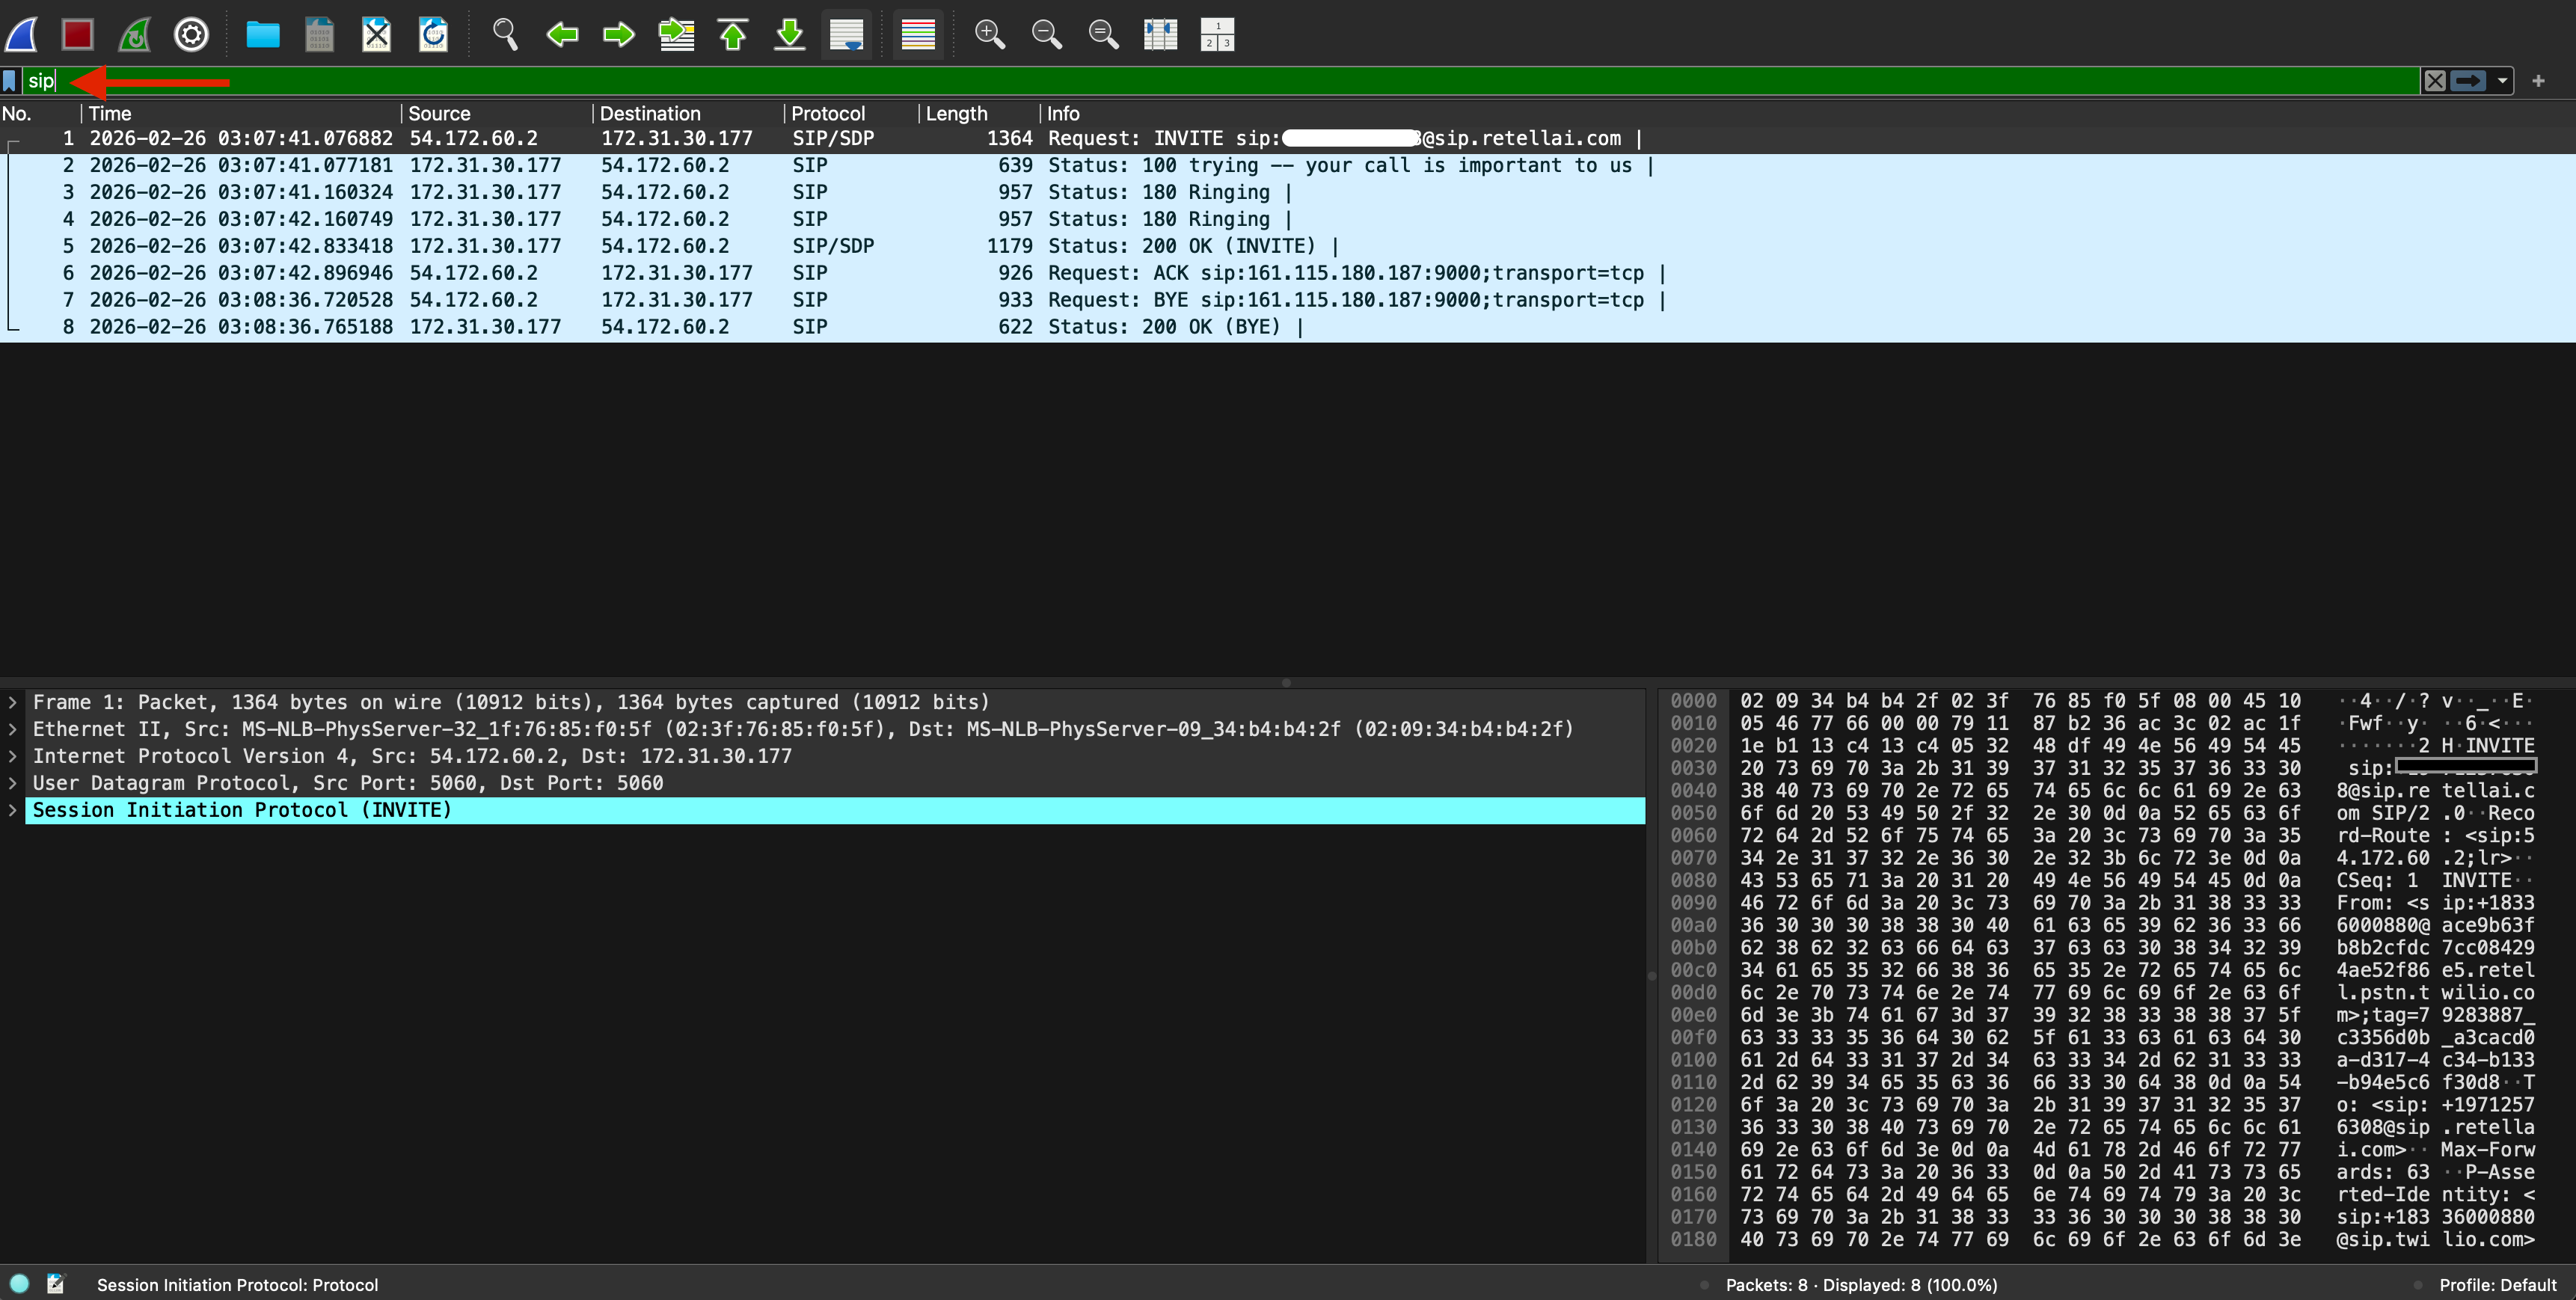
INVITE, 100 Trying, 180 Ringing, 200 OK, ACK, BYE, CANCEL, etc.
Filter for a specific call (optional)
If you need to isolate a single call, find theCall-ID value in any SIP packet, then filter on it:
Filter for RTP media streams
Step 2: Reconstruct the SIP call flow
After filtering SIP call(s), you can view the sequence (ladder) diagram by selecting Telephony → VoIP Calls: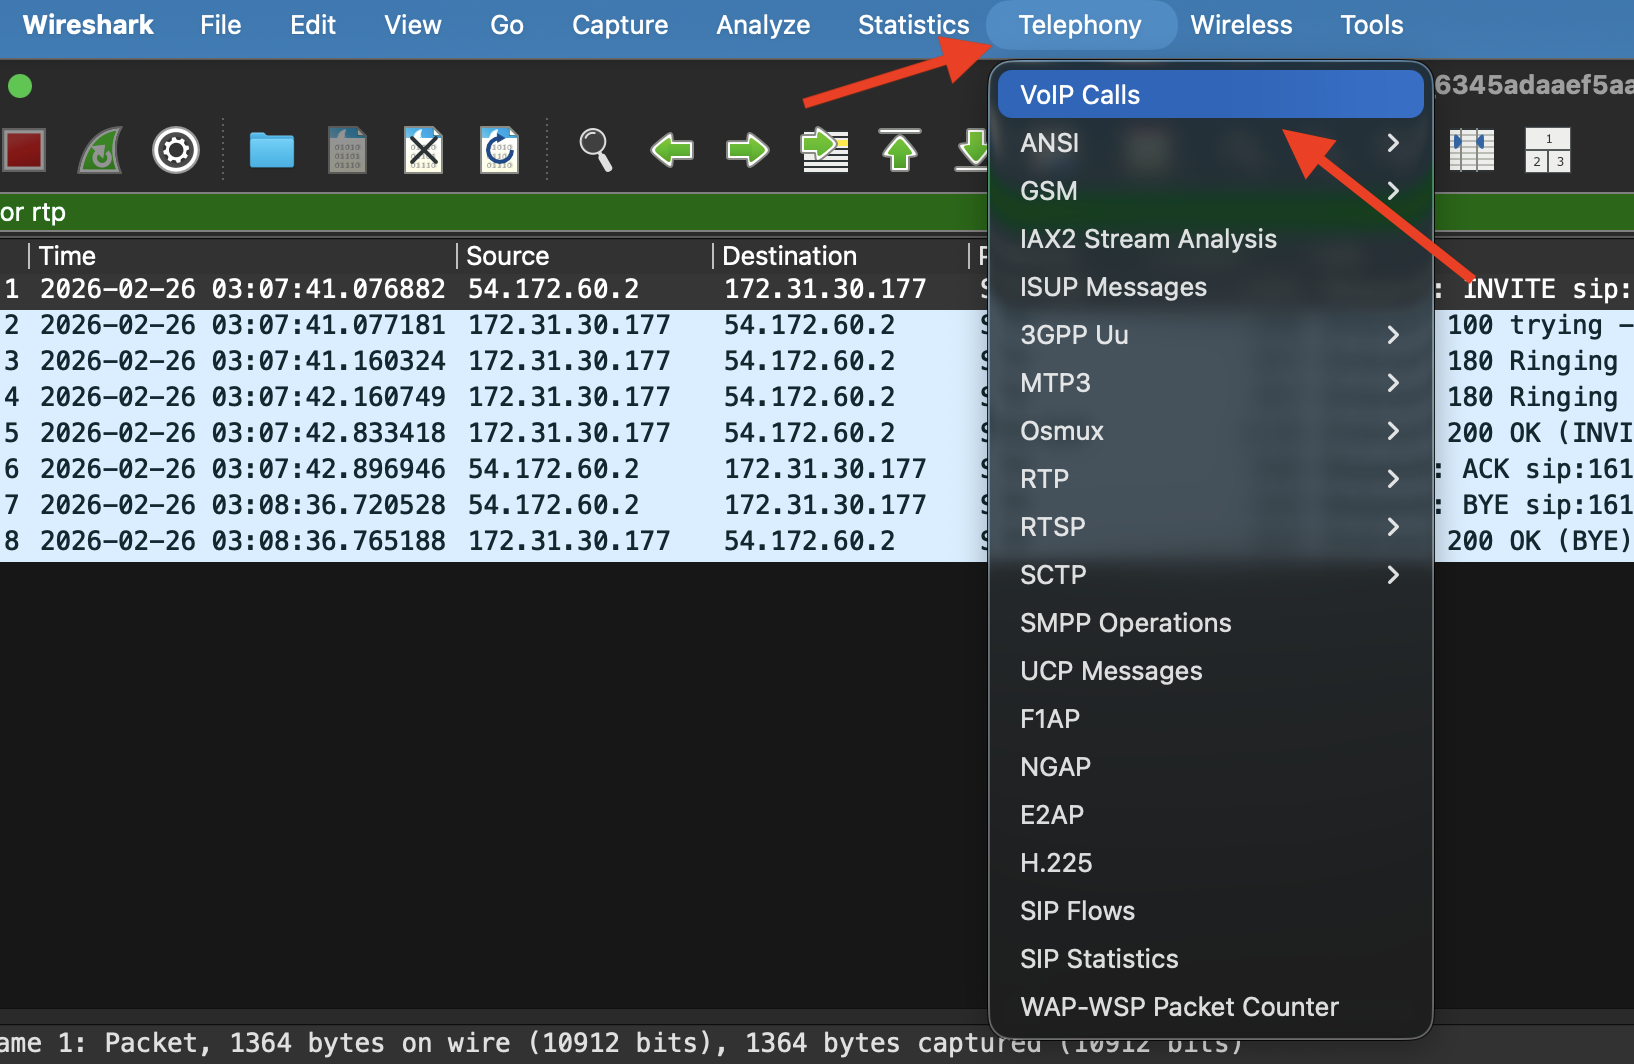
Navigate to Telephony → VoIP Calls
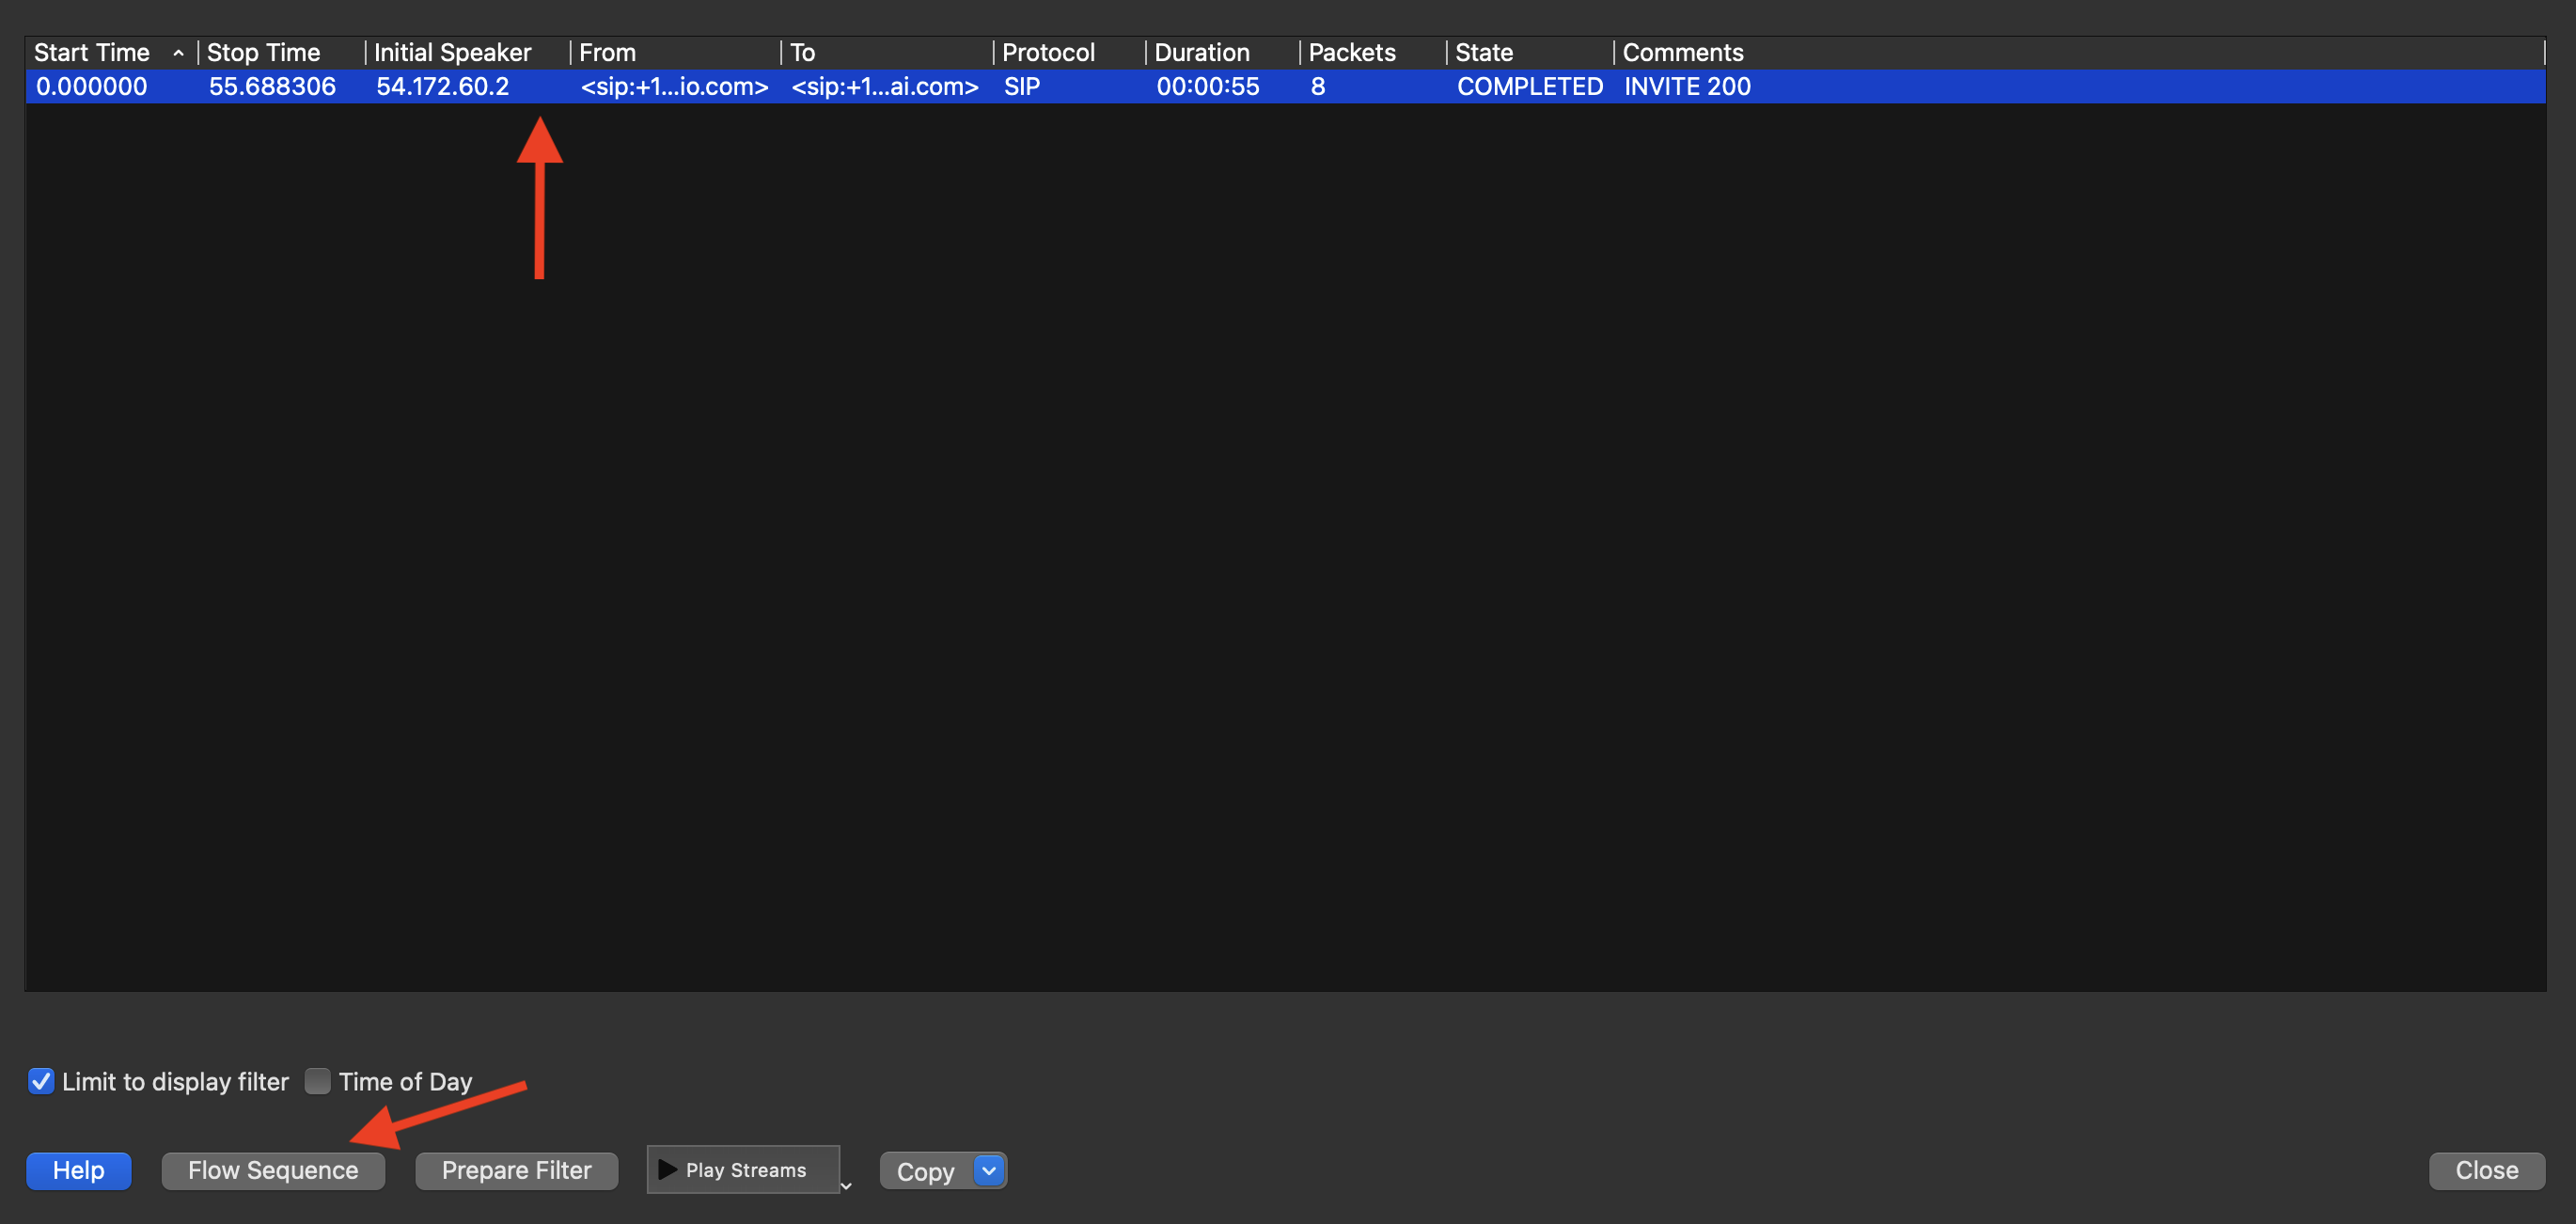
Select calls and view Flow Sequence
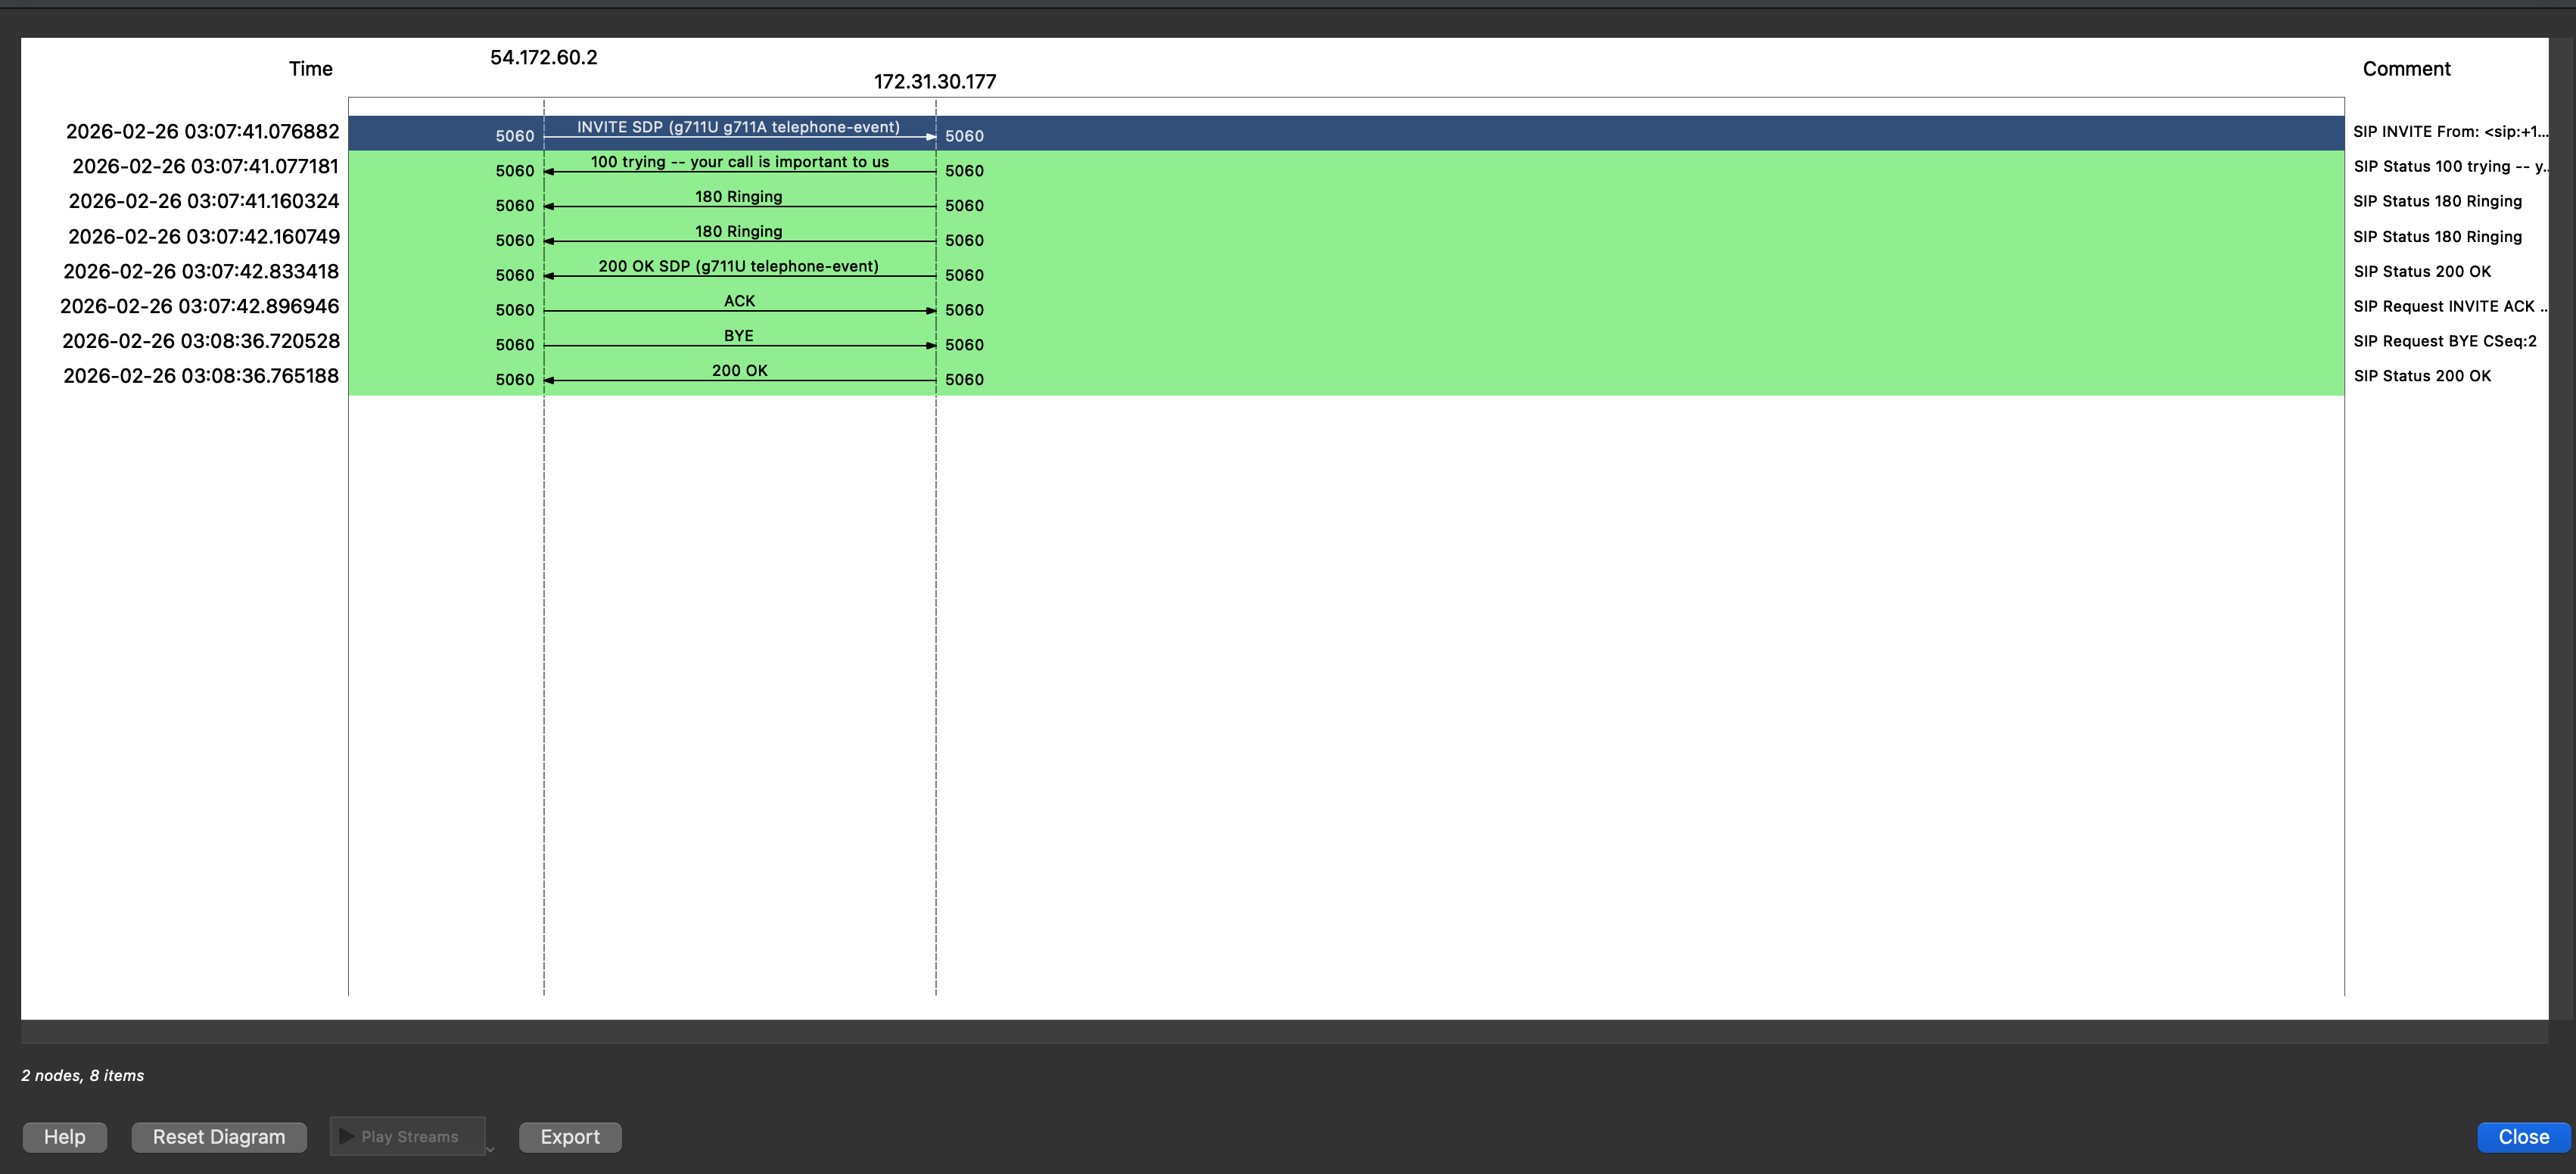
SIP ladder diagram showing call flow
INVITE → 100 Trying → 180 Ringing → 200 OK → ACK → BYE.
Read a SIP INVITE manually
Click theINVITE packet and expand Session Initiation Protocol in the packet detail pane. Key fields to inspect:
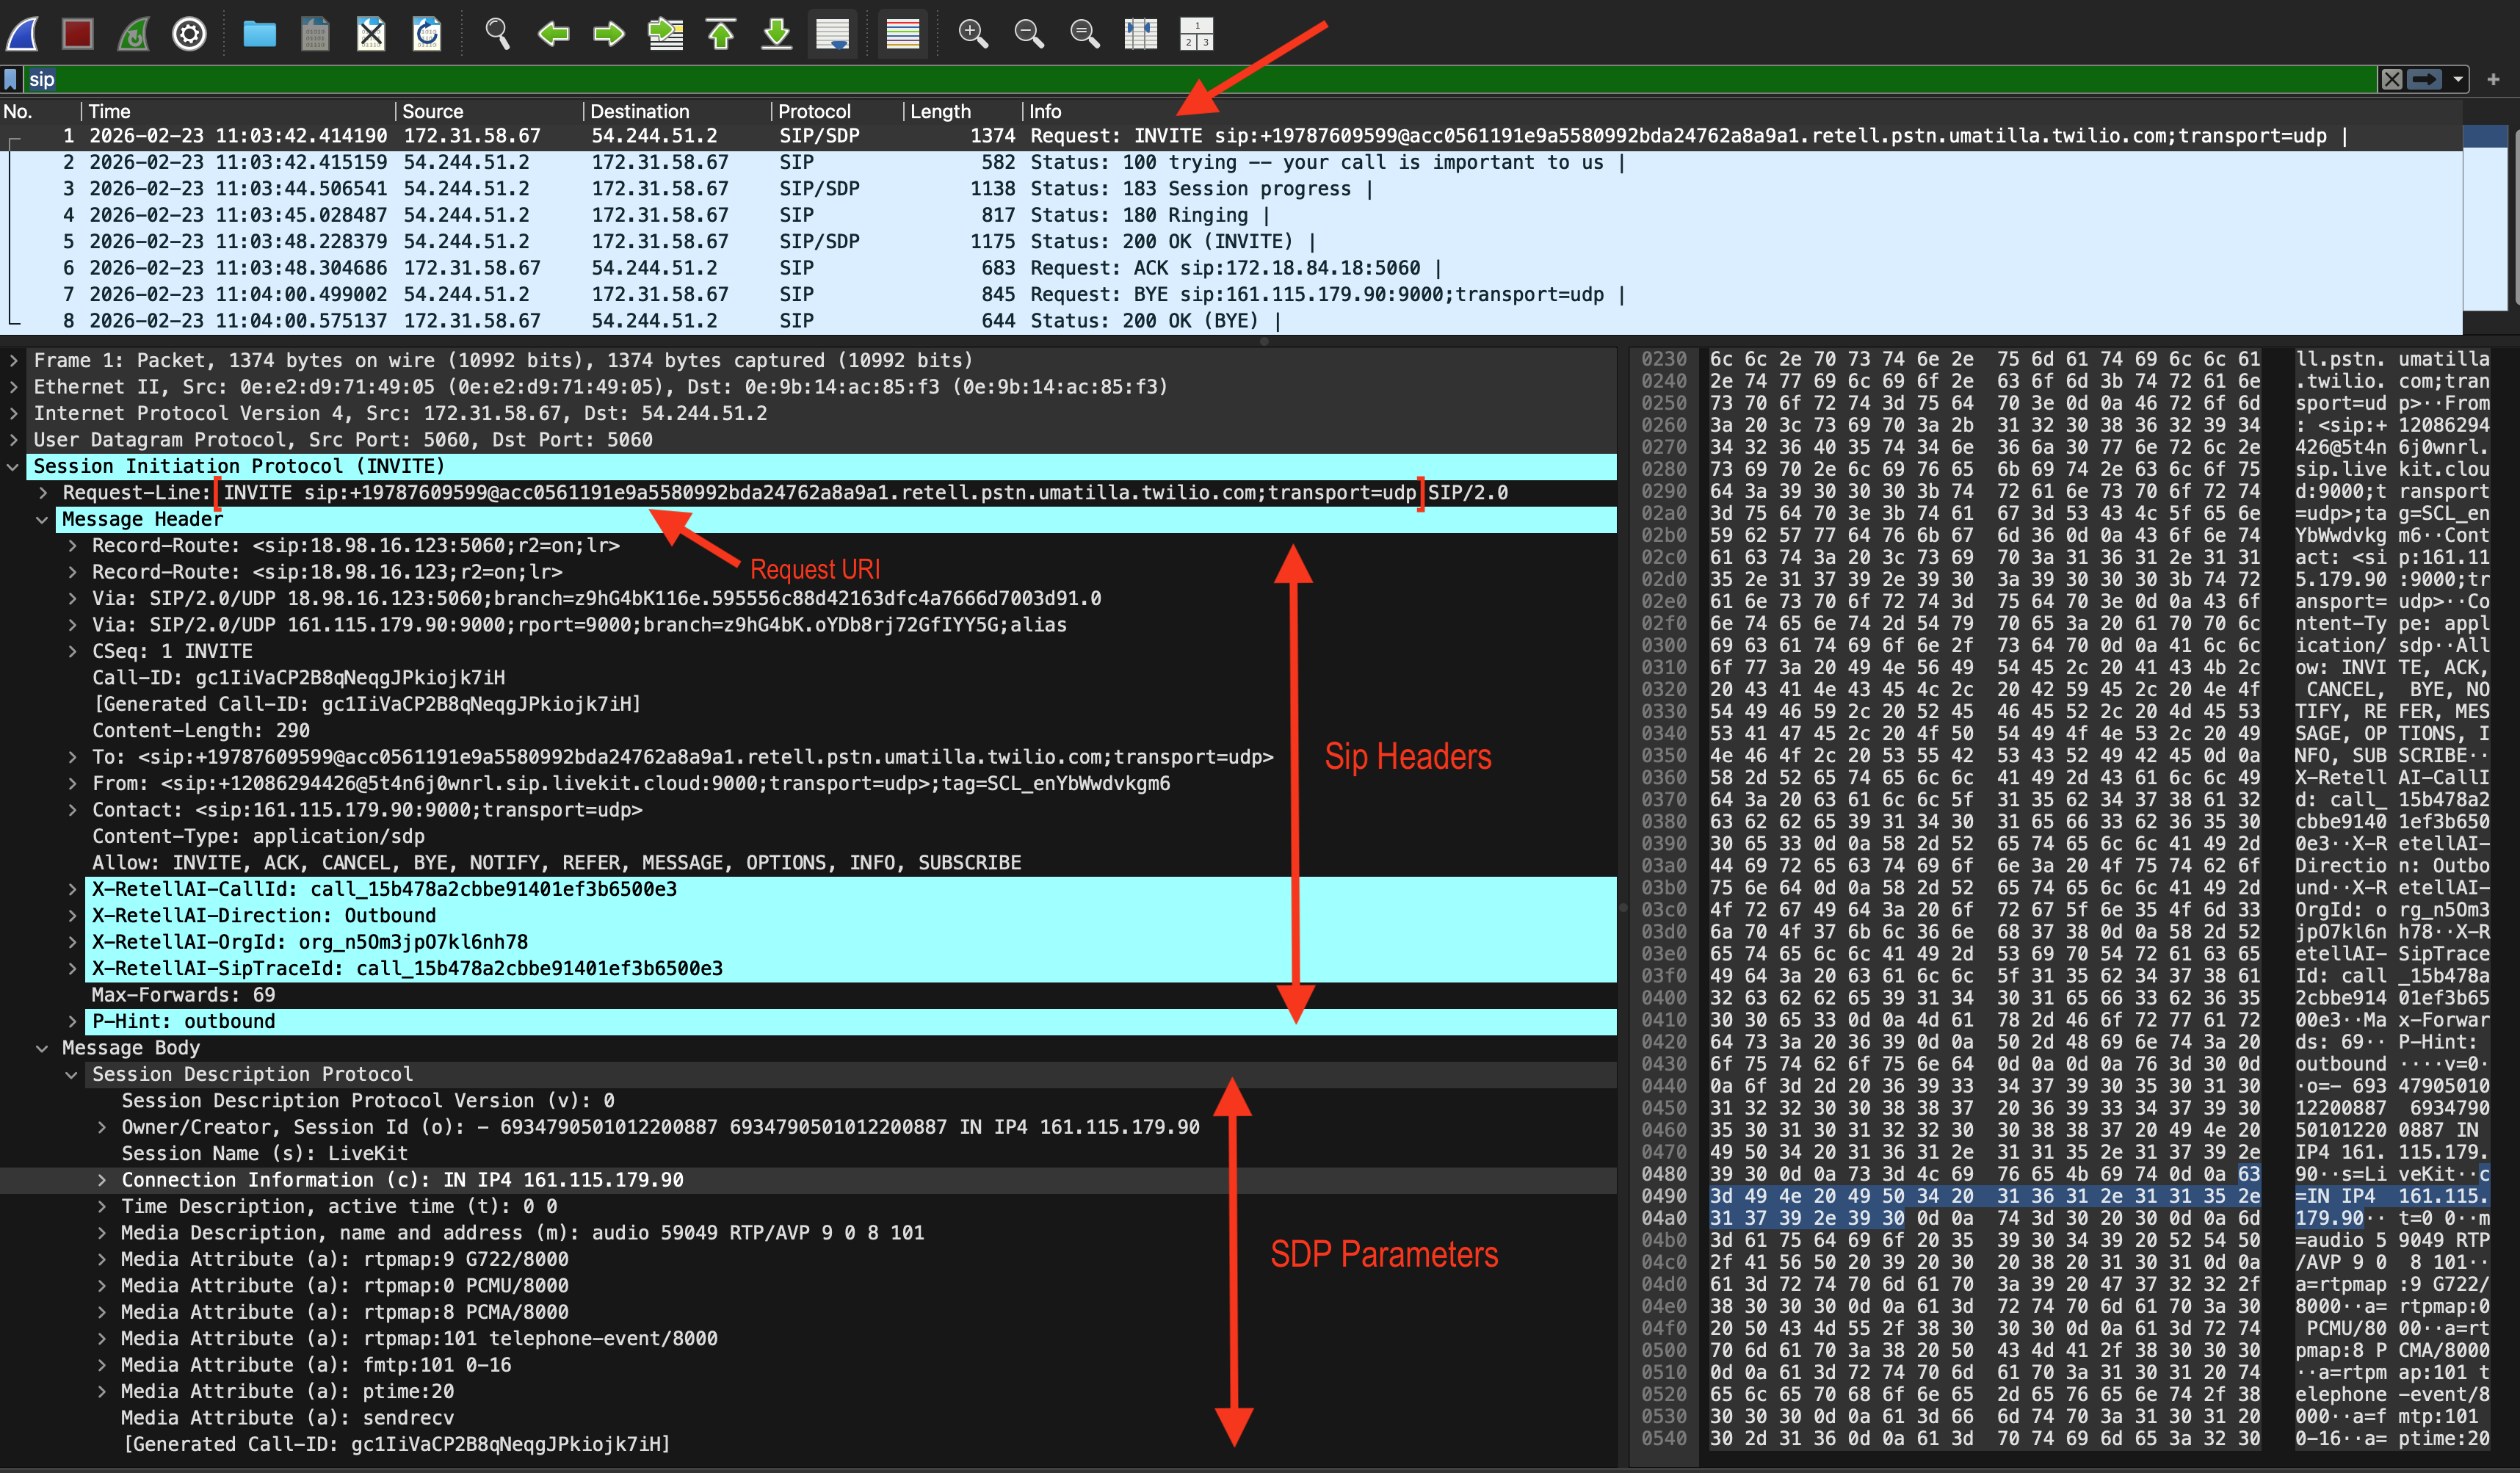
SIP INVITE packet details showing Request-URI, headers, and SDP parameters
Step 3: Common issues and what to look for
Common SIP response code reference
Quick reference: filter cheatsheet
Advanced debugging
The sections below use additional tools:tcpdump— command-line capture (pre-installed on Linux/macOS; see tcpdump.org for other platforms)sngrep— SIP-specific terminal UI (install instructions in the sngrep section below)
Analyze RTP streams
This applies only when your PCAP file contains RTP media packets. Some captures include SIP signaling only — for example, the PCAP files available on the Retell call details dashboard — in which case RTP and DTMF analysis are not available.View all RTP streams
Go to Telephony → RTP → RTP Streams. Wireshark lists each detected stream with:Play back RTP audio
- Select a stream in RTP Streams.
- Click Analyze → Play Streams.
- Wireshark decodes and plays back the audio. This lets you hear exactly what was sent or received.
Save RTP audio to a file
In the RTP player, click Save payload to export raw audio. You can then open it in Audacity or convert it with ffmpeg. Install ffmpeg if needed:brew install ffmpeg (macOS) or sudo apt install ffmpeg (Debian/Ubuntu).
Extract and inspect DTMF events
Check for DTMF negotiation in SDP
In theINVITE SDP body, look for:
101. If this line is absent, in-band or SIP INFO DTMF may be used instead.
RFC 2833 / RFC 4733 DTMF (most common)
DTMF tones sent as RTP events show up as separate RTP packets with the negotiated telephone-event payload type (commonly101).
Filter for them in Wireshark:
SIP INFO DTMF (less common)
Some providers send DTMF as SIP INFO messages instead of RTP. Filter for them:In-band DTMF (audio tones in RTP)
In-band DTMF is embedded in the audio stream as 350/440 Hz or 697–1633 Hz dual tones and cannot be filtered directly in Wireshark. To detect it:- Export the RTP audio as described in Analyze RTP streams above.
- Analyze in Audacity (View → Spectrogram) or use a DTMF decoder library.
Retell captures RFC 2833 DTMF by default. Refer to Capture DTMF input from user for configuring DTMF completion options (digit limit, termination key, timeout).
Capture a PCAP file
If you don’t already have a PCAP, capture one at the network level.Option A: Capture with tcpdump
tcpdump is pre-installed on Linux and macOS. For other platforms, see tcpdump.org.
Capture all SIP (port 5060) and RTP (UDP ports 10000–20000) traffic on your network interface:
Stop the capture with
Ctrl+C once the call ends.
Option B: Capture with Wireshark (GUI)
- Open Wireshark and select your network interface.
- Set the capture filter:
udp port 5060 or udp portrange 10000-20000 - Click Start (blue shark fin icon).
- Place and complete the test call.
- Click Stop, then File → Save As to save as
.pcapor.pcapng.
If you are using Retell with a custom SIP trunk, capture traffic on the server or gateway that terminates SIP — not your local machine. See Custom Telephony for Retell’s SIP server IP ranges to filter for.
Analyze with tshark (CLI)
For scripting and server-side analysis without a GUI:
Extract all SIP messages
List all RTP streams with stats
Extract RFC 2833 DTMF events
Export all RTP audio for a stream
Use sngrep for a quick terminal SIP view (optional)
sngrep provides a real-time or offline SIP ladder diagram in the terminal — no GUI needed.